 FAO Map Catalog
Tag_PAAT
Type of resources
Available actions
Topics
Keywords
Contact for the resource
Provided by
Years
Formats
Representation types
Update frequencies
status
Scale
-
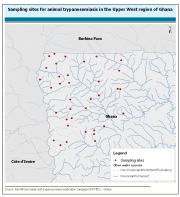
This dataset contains information on animal trypanosomiasis in the Upper West region of Ghana. It was generated within the framework of a tsetse and trypanosomiasis elimination campaign (Pan-African tsetse and trypanosomiasis eradication campaign (PATTEC) - Ghana).
-
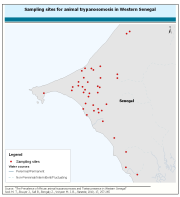
This dataset contains information on African animal trypanosomosis (AAT) in Western Senegal. Data were collected prior to the initiation of activities aimed at eliminating tsetse fly, the vector of the disease. Details on this dataset are availale in âThe Prevalence of African animal trypanosomoses and Tsetse presence in Western Senegalâ Seck M. T., Bouyer J., Sall B., Bengaly Z., Vreysen M. J. B., Parasite, 2010, 17, 257-265
-
Aggregated landcover database for United Republic of Tanzania (Africover) for tsetse habitat mapping
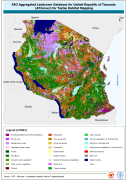
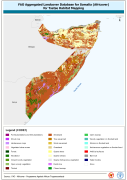
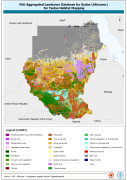
This dataset is an aggregated version of the original national Africover landcover multipurpose database. A 26-class legend is used to aggregate the classes present in the original full resolution, multipurpose landcover database. A single legend is applicable to the eight trypanosomiasis-affected countries mapped during Africover project (Burundi, Democratic Republic of the Congo, Kenya, Rwanda, Somalia, Sudan, Uganda and United Republic of Tanzania).
-
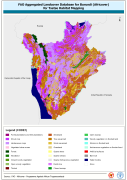
This dataset contains information on the apparent density of tsetse flies in three selected areas of Kenya (Lambwe Valley, Lake Bogoria and Meru/Mwea). It was genereated within the framework of a tsetse and trypanosomiasis elimination campaign (Pan-African tsetse and trypanosomiasis eradication campaign (PATTEC) - Kenya).
-
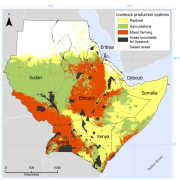
The dataset provides the distribution of pastoral, agro-pastoral and mixed farming systems in six countries of East Africa (Djibouti, Eritrea, Ethiopia, Kenya, Somalia, Sudan and Uganda). The production systems are defined according to the ratio of livestock- to crop-derived income. If L is defined as the total household income derived from livestock and C as the total household income derived from crops, then for pastoral production systems: L/C > 4; for agro-pastoral systems: 1 < L/C < 4; and for mixed farming systems L/C < 1. The map is based on datasets collected in the framework of livelihood analysis in the period 2000 and 2007. Input data were available for Djibouti, Eritrea, Kenya, Somalia, Uganda and parts of Ethiopia and Sudan. Data on these countries and regions provided the training data for the subsequent statistical analysis based on environmental and other geospatial predictors, which resulted in a full regional map. More detailed information on this datasets is available in “Geographic distribution and environmental characterization of livestock production systems in Eastern Africaâ€, 2009. Agriculture, Ecosystems & Environment, 135, 98-110.
-
This dataset is an aggregated version of the original national Africover landcover multipurpose database. A 26-class legend is used to aggregate the classes present in the original full resolution, multipurpose landcover database. A single legend is applicable to the eight trypanosomiasis-affected countries mapped during Africover project (Burundi, Democratic Republic of the Congo, Kenya, Rwanda, Somalia, Sudan, Uganda and United Republic of Tanzania).
-
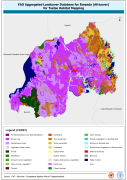
The dataset contains the predicted areas of suitability for the three tsetse fly groups (Fusca, Palpalis and Morsitans) and for 24 tsetse species. All of the distributions have been produced using variations of the same methodology - by modelling the "known" presence and absence of the flies (usually the 1977 Ford and Katondo maps modified with more recent information collected from national and international agencies and researchers). The modelling process relies on logistic regression of fly presence against a wide range of predictor variables for a large number of regularly spaced sample points for each area. The predictor variables include remotely sensed (satellite image) surrogates of climate - vegetation, temperature, moisture - which have been subjected to Fourier processing to provide an additional set of season and timing related measures for each parameter. Demographic, topographic and agroecological predictors are also used. These models are then applied to the predictor imagery to determine the probability of fly distributions. Data are provided at 5 kilometres resolution for the whole sub-Saharan Africa. The 5km continental maps were produced in November 1999 for FAO Animal Health and Production Division and DFID Animal Health Programme by Environmental Research Group Oxford (ERGO Ltd) in collaboration with the Trypanosomosis and Land Use in Africa (TALA) research group at the Department of Zoology, University of Oxford.
-
This dataset is an aggregated version of the original national Africover landcover multipurpose database. A 26-class legend is used to aggregate the classes present in the original full resolution, multipurpose landcover database. A single legend is applicable to the eight trypanosomiasis-affected countries mapped during Africover project (Burundi, Democratic Republic of the Congo, Kenya, Rwanda, Somalia, Sudan, Uganda and United Republic of Tanzania).