 FAO Map Catalog
SOLAW
Type of resources
Available actions
Topics
Keywords
Contact for the resource
Provided by
Years
Formats
Representation types
Update frequencies
status
Scale
Resolution
-
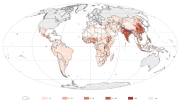
Chronic child malnutrition (stunting among children under 5 years of age) represents a good proxy of rural poverty and food insecurity (FAO 2008 and FAO 2003) and, by overlaying stunting rate and population density, this map aims at showing poor population distribution (person/sq km) in developing countries.
-
This map is adapted from a global GIS database maintained by FAO on food insecurity, poverty and environment global GIS database (FGGD). It is based on stunting data among children under 5 years of age, around year 2000. Stunting among children is used by FAO as an indicator of food insecurity and, indirectly, of poverty.
-
This map builds upon work done by Dixon (Dixon et al., 2001) in an attempt to propose a general classification of major farming systems. Based on a combination of global dataset, the map proposes a harmonized classification of major agricultural systems used as the basis for the analysis of SOLAW's Systems at risk. The map is based on an interpretation of global land cover data, combined with thematic datasets showing irrigated land and paddy rice extent. The map is published in SOLAW Report: The state of the world's land and water resources for food and agriculture - Managing systems at risk (2011) and SOLAW Thematic Report 15: Sustainable options for addressing land and water problems - a problem tree and case studies (links in the online resources section).
-
This map represents the spatial distribution of land under irrigation which is affected by some degree of salinization. It was produced by combining FAO AQUASTAT country statistics regarding irrigated areas affected by salinization with spatial information on irrigated areas where precipitation is not sufficient to leach away salt residues that are built up in the soil due to irrigation. It was assumed that the risk of salinization of irrigated areas can occur only in areas with an Aridity Index lower than 0.65 (where the Aridity Index is defined as Yearly Precipitation divided by Yearly Reference Evapotranspiration).
-
This map, compiled to support the analysis of SOLAW report concerning land tenure and water rights (FAO -NRL, SOLAW 2010 Report 5A - Hotspots of land tenure and water rights) shows the population growth rate, in percentage, according to CIA Factbook 2006. The need to feed 9 billion people by 2050 implies that the pressure on land and water will generally increase. Countries with the highest population growths rate are also those for which the number of calories available per person per day is lower. They are also, in part, countries in which the volume of water available per capita and year is the lowest.
-
The map shows the dominant soil and terrain constraints of land for high input farming conditions. The map was developed within the IIASA/FAO GAEZ 2009 modelling framework. Agricultural input and management increases can help to overcome to some degree soil and terrain constraints in all regions, most visible in the maps in particular in Eastern Africa, India and Australia.
-
The map accompanies the SOLAW report 14 âWhere are the poor and where are the land and water resourcesâ. The analysis addressed in this report is aimed at identifying areas where land, water resources and farming systems pose potential threats to livelihoods. In particular this map, accompanying the report, shows the share of agricultural land by region. The data for the analysis comes from the FAO GeoNetwork data archive. The methodology draws from the main hypotheses set in the analysis that are to: ⢠test if per capita share of land and water resources have a significant association with poverty ⢠if land suitability and farming systems modify that relationship. The key element of the methodology developed is referred to as the âPrincipal Component Analysisâ (PCA), which is used to derive a single resource management index based on land and water resources, land suitability and farming systems. PCA involves a mathematical procedure that transforms a number of correlated variables into a smaller number of uncorrelated variables called Principal Components (PC). The new sets of variables (PCs) are a linear combination of the original variables which are derived in decreasing order of importance, with the first principal component accounting for as much of the variability in the data as possible, and each succeeding component accounts for as much of the remaining variability. The first PC, which is a measure of variability in access to land and water resources and in farming systems, is chosen as the resource management index. The results from the analysis are presented in the form of graphs and maps that answer the following questions: ⢠Where are the rural poor concentrated? ⢠Where are the poor in relation to land and water resources and farming systems? ⢠To what extent do access to land and water resources and current farming systems constrain livelihoods for the poor? ⢠Can changes in resource management modify poverty outcomes in resource-constrained areas? The map addresses the second question and shows the per capita share of land by region and rural-urban localities. There exist substantial variations in per capita share of land across the regions of the world. The per capita share of land in Asia is only 10.0km2 per 1000 people, in Europe it is 11.4km2, in Africa it is 31.3km2, 33.3km2 in America and 105.2km2 in Oceania. Per capita share of land is higher in rural areas than urban areas in all regions of the world.
-
The map accompanies the SOLAW report 14 âWhere are the poor and where are the land and water resourcesâ. The analysis addressed in this report is aimed at identifying areas where land, water resources and farming systems pose potential threats to livelihoods. In particular this map, accompanying the report, shows the per capita share of easily available water by region. The data for the analysis comes from the FAO GeoNetwork data archive. The methodology draws from the main hypotheses set in the analysis that are to: ⢠test if per capita share of land and water resources have a significant association with poverty ⢠if land suitability and farming systems modify that relationship. Principal Component Analysis (PCA) is used to derive a single resource management index based on land and water resources, land suitability and farming systems. PCA involves a mathematical procedure that transforms a number of correlated variables into a smaller number of uncorrelated variables called Principal Components (PC). The new sets of variables (PCs) are a linear combination of the original variables which are derived in decreasing order of importance, with the first principal component accounting for as much of the variability in the data as possible, and each succeeding component accounts for as much of the remaining variability. The first PC, which is a measure of variability in access to land and water resources and in farming systems, is chosen as the resource management index. The results from the analysis are presented in the form of graphs and maps that answer the following questions: ⢠Where are the rural poor concentrated? ⢠Where are the poor in relation to land and water resources and farming systems? ⢠To what extent do access to land and water resources and current farming systems constrain livelihoods for the poor? ⢠Can changes in resource management modify poverty outcomes in resource-constrained areas? The map shows per capita share of easily available water by region and rural-urban localities. Per capita share of easily available water is lowest in Asia â 5.8 mm/month per 1000 people. In Europe, America and Africa it is 6.2, 14.8 an 15.2 mm/month per 1000 people, respectively compared to 37.7 mm/month per 1000 in Oceania. Substantial rural-urban differentials exist in per capita share of easily available water. In rural areas of Asia, per capita share of easily available water is only 0.46 mm/month per 1000 people compared to 10.2 in urban areas of Asia.
-
The map is compiled for the SOLAW Report: "Sources of water for agriculture". Data are available from AQUASTAT - programme of the Land and Water Division of the Food and Agriculture Organization of the United Nations. Perhaps the most widespread indicator of water scarcity at country level that can be found in literature is per capita availability of average renewable water resources, using threshold values of 500, 1 000 and 1 700 m3/person per year (Falkenmark and Widstrand, 1992; UN-Water, 2006b). Under this system countries or regions are considered to be facing absolute water scarcity if water availability is < 500 m3 per capita per year, chronic water shortage if water availability is between 500 and 1 000 m3, regular water stress between 1 000 and 1 700 m3, and occasional stress or local stress can occur also at levels above 1 700 m3. This relatively simple approach to measuring water scarcity was primarily based on estimates of the number of people who can reasonably live with a certain unit of water resources (Falkenmark, 1984). This indicator is widely used because it can be easily calculated for every country in the world and for every year, based on long-term average annual water resources data (FAO, 2010a) and available population data (UN, 2009).
-
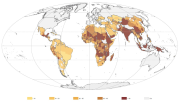
The map accompanies the SOLAW report 8 âAgriculture and water quality interactionsâ. Arsenic contamination in groundwater has been reported in more than 20 countries around the world and, in many, shallow groundwater is used for both drinking and irrigation purposes. Natural arsenic in groundwater at concentrations above the drinking water standard of 10 µg/litre is not uncommon, and the realization that water resources can contain insidious toxic concentrations of naturally-occurring chemical constituents, such as arsenic, is fairly recent and increasingly urgent. First estimates of arsenic toxicity (arsenosis) from drinking water, causing skin lesions and various types of cancers, indicate about 130 million people are impacted. Although the main geochemical mechanisms of arsenic mobilization are well understood, and there are important cases reported around the world, the real worldwide scale of affected regions is still unknown. Amini. et al 2008 conducted a study using a large database of measured arsenic concentration in groundwater (around 20,000 data points) from around the world as well as digital maps of physical characteristics such as soil, geology, climate, and elevation to model probability maps of global arsenic contamination. This map therefore shows, at global scale, probability of geogenic arsenic contamination in groundwater for oxidizing groundwater conditions, based on modelling the above information.