 FAO Map Catalog
Population
Type of resources
Available actions
Topics
Keywords
Contact for the resource
Provided by
Years
Formats
Representation types
Update frequencies
status
Scale
Resolution
-
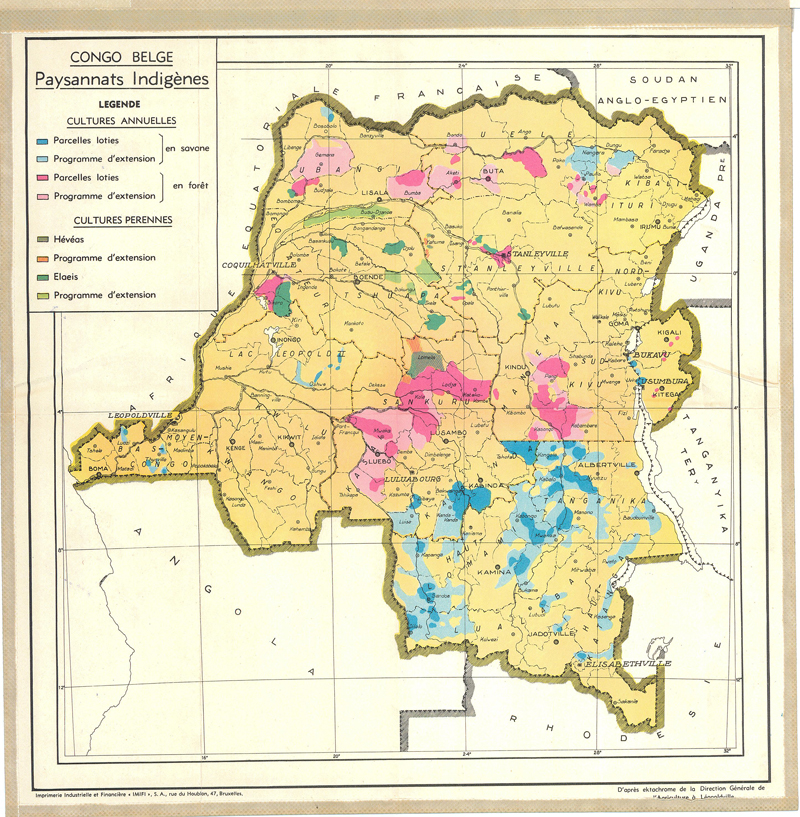
Coverage: Congo, Dem. , Burundi, Rwanda (Land use)
-
Data for the years 2000 and 2010 is from the Census of Population and Housing. Data for the other years (2001 to 2009 and 2011 to 2014) was projected. **Table content** - Year - Indicator - Item - Value - Flag - Unit of Measure
-
Agriculture and Non-Agriculture populations were estimated by multiplying the Number of Agriculture Households or the Number of Non-Agriculture Households by the average household size. Data for the years 2000 and 2010 is from the Census of Population and Housing. Data for the other years (2001 to 2009 and 2011 to 2014) was projected. Muchinga Province has no data in the years 2000 to 2009 because it did not exist that time. There is no data in the years 2001 to 2009 and 2011 to 2014 because there are no projections for Agriculture and Non Agriculture population. **Table content** - Year - Indicator - Item - Gaul - Value - Flag - Unit of Measure
-
The "Major Cities" layer is derived from the "World Cities" dataset provided by ArcGIS Data and Maps group as part of the global data layers made available for public use. "Major cities" layer specifically contains National and Provincial capitals that have the highest population within their respective country. Cities were filtered based on the STATUS (“National capital”, “National and provincial capital”, “Provincial capital”, “National capital and provincial capital enclave”, and “Other”). Majority of these cities within larger countries have been filtered at the highest levels of POP_CLASS (“5,000,000 and greater” and “1,000,000 to 4,999,999”). However, China for example, was filtered with cities over 11 million people due to many highly populated cities. Population approximations are sourced from US Census and UN Data. Credits: ESRI, CIA World Factbook, GMI, NIMA, UN Data, UN Habitat, US Census Bureau Disclaimer: The designations employed and the presentation of material at this site do not imply the expression of any opinion whatsoever on the part of the Secretariat of the United Nations concerning the legal status of any country, territory, city or area or of its authorities, or concerning the delimitation of its frontiers or boundaries.
-

Include : Cattle Population (fig. 3)
-
Mapa de la Republica de Honduras (Land in use for agriculture livestock excluded in % of total area)
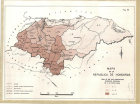
Include : Land in use for agriculture livestock excluded in % of total area (fig. 6)
-
Include : Production of Cereals (fig. 2) Cattle Population (fig. 3) Planted Areas in % of total area (fig. 4) Land in use for agriculture livestock excluded in % of total area (fig. 6)
-

Include : Planted Areas in % of total area (fig. 4)
-
Data for the years 2000 and 2010 is from the Census of Population and Housing while Data for the other years (2001 to 2009 and 2011 to 2014) was projected. Muchinga has no data in the years 2000 to 2009 because it did not exist that time.. **Table content** - Year - Indicator - Item - Gaul - Value - Flag - Unit of Measure
-
Agriculture and Non-Agriculture populations were estimated by multiplying the number of Agriculture Households or the number of Non-Agriculture households by the average household size. This data is from the Census of Population and Housing for the years 2000 and 2010. It contains information on the distribution of households by whether the household is an agriculture household or not. The years from 2001 and 2009 and 2011 to 2014 are blank because estimates of agriculture and non agriculture households are not done between census years. **Table content** - Year - Indicator - Item - Value - Flag - Unit of Measure **Value assigned to No-data**:m