 FAO Map Catalog
NDVI
Type of resources
Available actions
Topics
Keywords
Contact for the resource
Provided by
Formats
Representation types
Update frequencies
status
-
The Normalized Difference Vegetation Index (NDVI) is computed by applying the ration between red and NIR spectral bands and maximum aggregated over MOFALI center pivots in Khongor, Mongolia for the Kharif season (July to October) 2019.
-
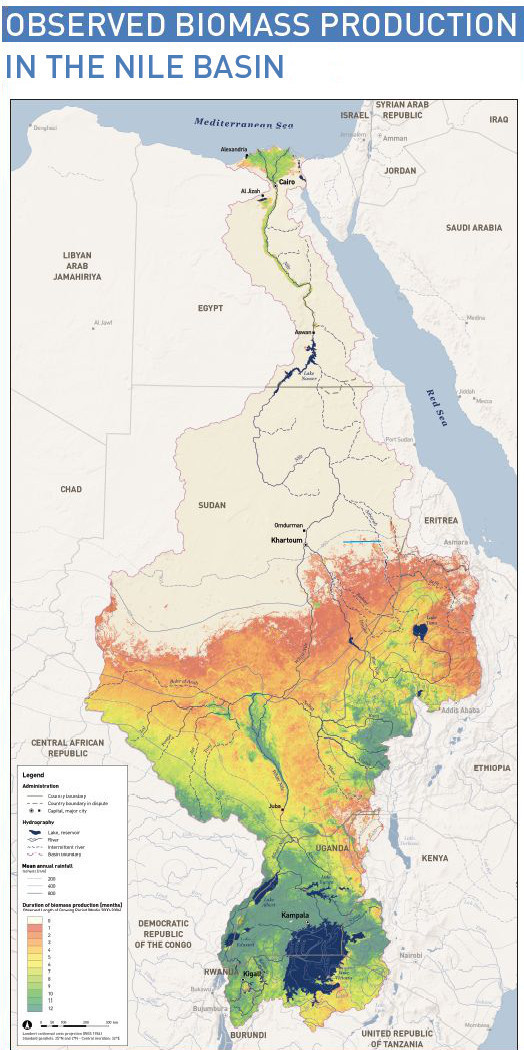
This map shows the spatial distribution of observed biomass production in the Nile Basin. It also relates annual biomass production to the irrigation volumes withdrawn from the Nile and to total annual rainfall. Biomass production is calculated monthly using the Normalized Difference Vegetation Index (NDVI). The base data are obtained from the orbiting MODIS Terra satellite sensor for the period 2000 to 2004. For all Nile countries annual rain volumes and biomass production are calculated and represented by proportional circles, which are drawn to the scale of the map. The green area represents total vegetation growth under rainfall while the blue area is the amount of biomass from stream flow. As can be observed, large parts of Egypt and the Sudan (the Sahara Desert) have no vegetation at all. On the other hand, the Lake Victoria region is covered with vegetation throughout the year, so is the Sudd in southern Sudan. This map clearly indicates where water is the main constraint to vegetation growth. It should be noted, however, that it does not consider the quality of the vegetation.
-
The Normalized Difference Vegetation Index (NDVI) is computed by applying the ration between red and NIR spectral bands and maximum aggregated over Narayanapur Left Bank Canal (NLBC) in Karnataka state of India for the Kharif season (July to December) over the years 2017, 2018 and 2019.