 FAO Map Catalog
Mozambique
Type of resources
Available actions
Topics
Keywords
Contact for the resource
Provided by
Formats
Representation types
Update frequencies
status
Scale
-
Mapa Mundial de Solos - Carta dos solos de Mazambique (4 000 000)
-
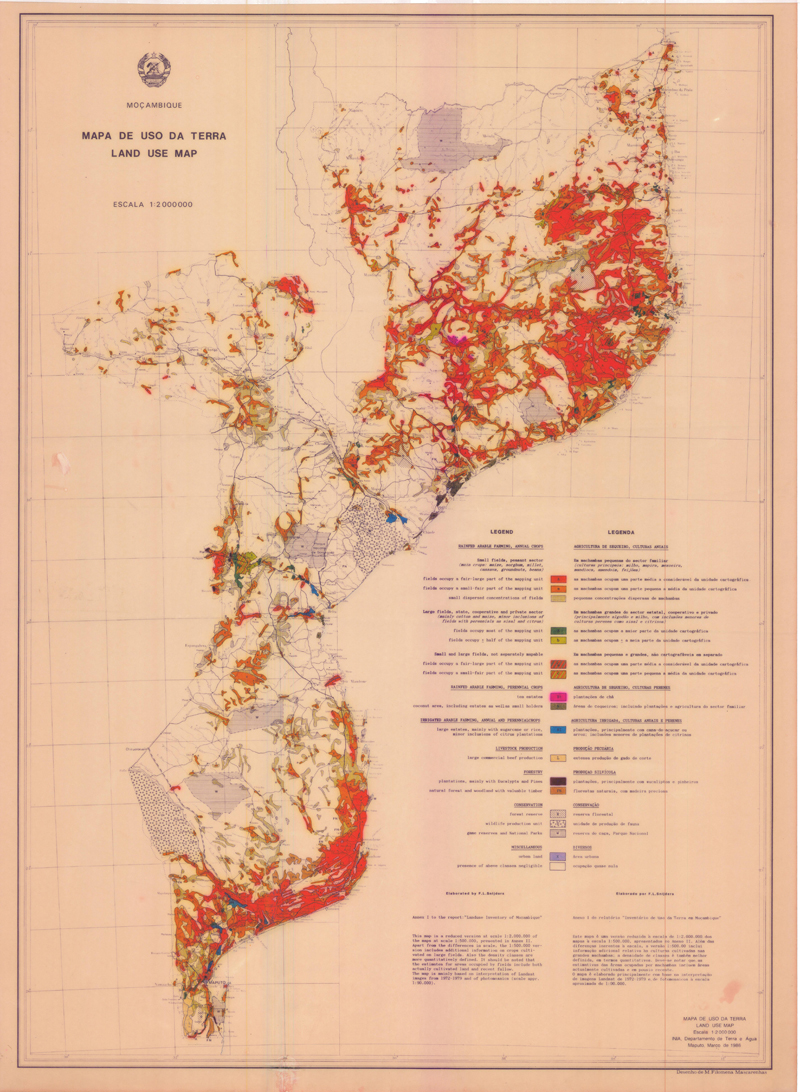
Land use map
-
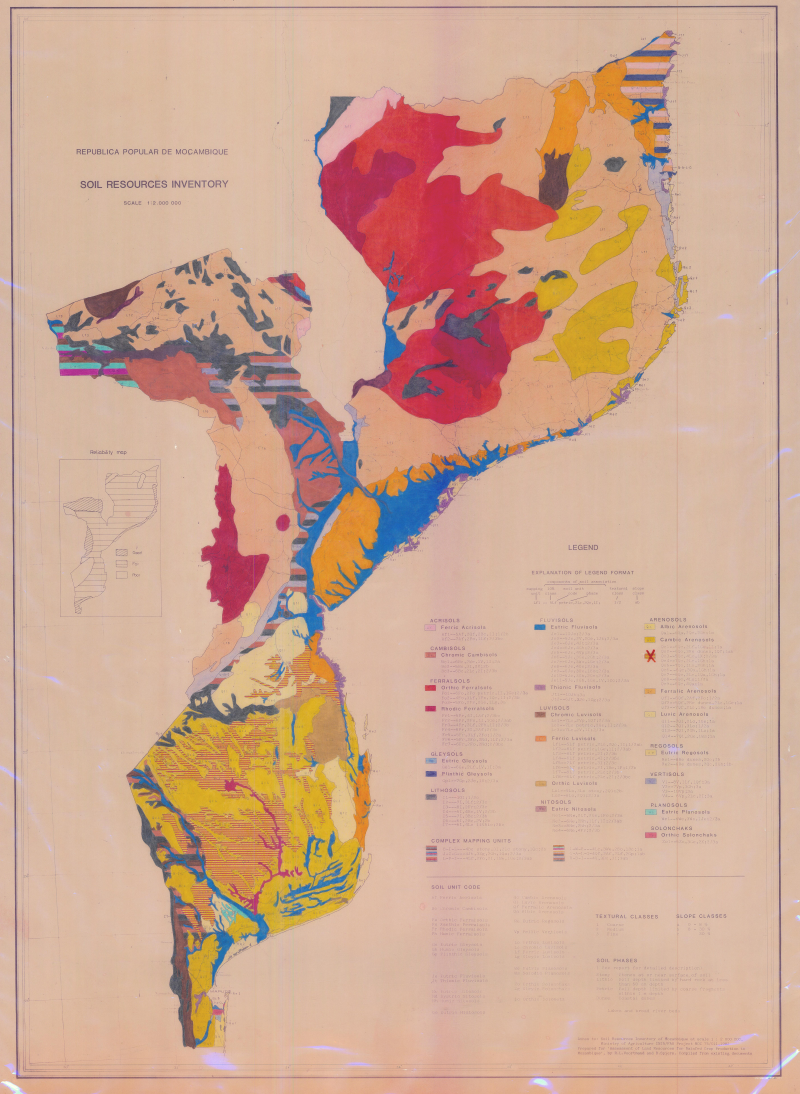
Soil resources inventory
-
only legend sheet
-
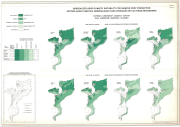
Include: High level of inputs & low level of inputs, Maize, Sorghum, Pearl Millet, Wheat (Sheet 1), High level of inputs & low level of inputs: Soybean, Groundnuts, Cassava, Cotton (Sheet 2).
-
The transpiration (T) data component (dekadal, in mm/day) is the actual transpiration of the vegetation canopy. The value of each pixel represents the average daily actual transpiration for that specific dekad. The data is provided in near real time from January 2009 to present.
-
The layer gives an indication of the quality of the NDVI input data. It shows whether a valid observation was available for that dekad, and if not, the length of the data gap since the nearest valid observation, in dekads. The data is provided in near real time from January 2009 to present.
-
Total Biomass Production (TBP) is defined as the sum of the above-ground dry matter produced during the course of the growing season. The seasonal value represents the total accumulated biomass during one growing season, from start of season (SOS) to end of season (EOS). A pixel value of -9997 denotes "out of season". The data is provided in near real time from January 2009 to present.
-
The actual EvapoTranspiration and Interception (ETIa) is the sum of the soil evaporation (E), canopy transpiration (T), and evaporation from rainfall intercepted by leaves (I). The value of each pixel represents the average daily ETIa in a given dekad. The data is provided in near real time from January 2009 to present.
-
The Transpiration (T) data component is the actual transpiration of the vegetation canopy. The value of each pixel represents the total annual transpiration for that specific year. The data is provided in near real time from January 2009 to present.