 FAO Map Catalog
Monthly
Type of resources
Available actions
Topics
Keywords
Contact for the resource
Provided by
Years
Formats
Representation types
Update frequencies
status
-
Climate Hazards Group InfraRed Precipitation with Station data (CHIRPS) is a 30+ year quasi-global rainfall dataset. CHIRPS incorporates 0.05° resolution satellite imagery with in-situ station data to create gridded rainfall time series for trend analysis and seasonal drought monitoring. Approximately 5km (0.05°) unit: "mm" dataType: "Float32" noDataValue: -9999
-
Incremental Evapotranspiration calculated over the study area of Mindanao island of Philippines. The incremental evapotranspiration (etincr) is the evapotranspriation of blue water, in other words the incremental evapotranspiration is the fraction of the total actual evapotranspiration that is not due to rainfall. The calculation of Incremental Evapotranspiration is based on a pixel-based soil moisture balance model. More information can be found at: https://github.com/wateraccounting/WAPORWA.
-
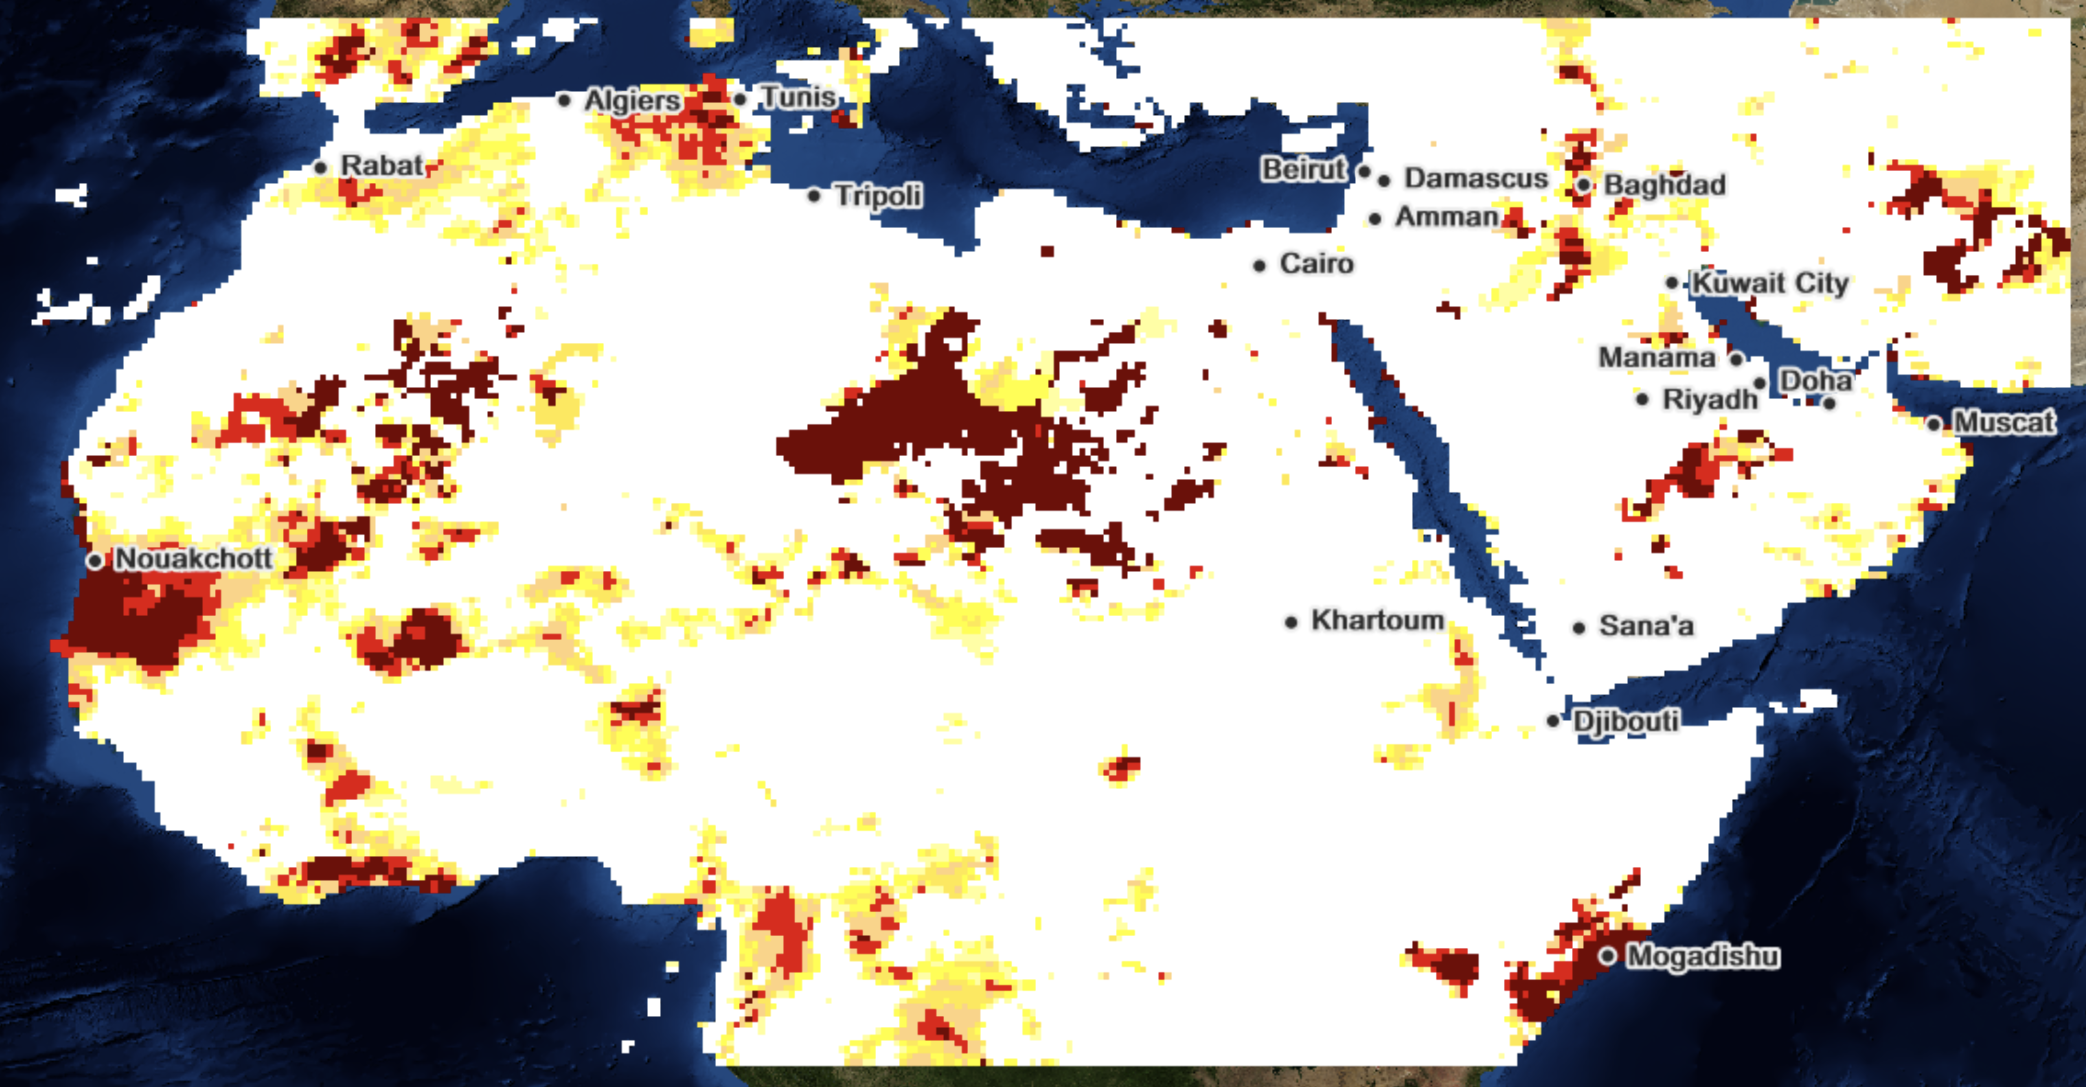
Precipitation anomalies captured through the Standardized Precipitation Index (SPI)using CHIRPS data highlighting whether it is wetter/drier than usual for that month. The data is published on MAWRED (Monitoring Agriculture and Water Resources during Droughts) and was generated by ICBA (International Centre for Biosaline Agriculture)
-

Climate Hazards Group InfraRed Precipitation with Station data (CHIRPS) is a 30+ year quasi-global rainfall dataset. CHIRPS incorporates 0.05° resolution satellite imagery with in-situ station data to create gridded rainfall time series for trend analysis and seasonal drought monitoring. The z-score (or standard score) is the signed fractional number of standard deviations by which the value of an observation or data point is above the mean value of what is being observed or measured. Observed values above the mean have positive standard scores, while values below the mean have negative standard scores. Z-scores reveals whether a score is typical for a specified data set or if it is atypical. Approximately 5km (0.05°) unit: "mm" dataType: "Float32" noDataValue: -9999
-

Forecasts of Monthly Precipitation Anomalies. More info on the model in the BAMS article describing the project (Kirtman et al. 2014) at https://journals.ametsoc.org/view/journals/bams/95/4/bams-d-12-00050.1.xml Source: North American Multi-Model Ensemble Approximately 111km (1°) unit: "mm" dataType: "Float32" noDataValue: -9999
-
Precipitation calculated over the study area of Mindanao island of Philippines. The dataset is the GPM IMERG final run product resampled to 250 from 5000m GPM precipitation product. More information at: https://gpm.nasa.gov/resources/documents/IMERG-V06-Technical-Documentation.
-
Interception calculated over the study area of Mindanao island of Philippines. The Interception (I) data component (monthly, in mm/day) represents the evaporation of intercepted rainfall from the vegetation canopy. Interception is the process where rainfall is captured by the leaves. Part of this captured rainfall will evaporate again. The value of each pixel represents the average monthly evaporated interception for that specific month.
-

Net Primary Production (NPP) is a fundamental characteristic of an ecosystem, expressing the conversion of carbon dioxide into biomass driven by photosynthesis. The pixel value represents the NPP for that specific month. The data is provided in near real time from January 2015 to present.
-
Extent of the water catchment area of Lake Tengiz which in Kazakhstan.