 FAO Map Catalog
Mali
Type of resources
Available actions
Topics
Keywords
Contact for the resource
Provided by
Formats
Representation types
Update frequencies
status
Scale
-
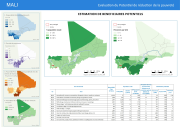
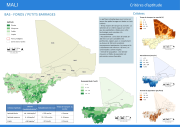
The potential for investment in water in support to rural livelihoods is a function of the demand from rural population and the availability of the resource. The maps below show a distribution of rural population who could benefit from water- related interventions. The level of demand is based on the analysis of the livelihood zones described above, combined with poverty level. The map of livelihood zones is the main output from a participatory mapping workshop and forms the basis for the overall AWM assessment. It describes and geographically locates the different country livelihood contexts, focusing on the main smallholdersâ livelihood strategies, their water-related problems and other constraints for development, and the role agricultural water management plays for their livelihoods. An attribute table provides a detailed description of each livelihood zone.
-
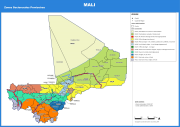
Livelihood zoning consists in identifying areas where rural people share relatively homogeneous living conditions, on the basis of a combination of biophysical and socio-economic determinants. The main criteria to establish livelihood zones are: the predominant source of income (livelihood activities); the natural resources available to people and the way they are used; and the prevailing agroclimatic conditions that influence farming activities. Patterns of livelihood vary from one area to another, based on local factors such as climate, soil or access to markets. The analysis delineates geographical areas within which people share similar livelihood patterns: source of living, access to food, farming practices, including crops, livestock and access to markets. The map of livelihood zones is the main output from a participatory mapping workshop and forms the basis for the overall AWM assessment. It describes and geographically locates the different country livelihood contexts, focusing on the main smallholdersâ livelihood strategies, their water-related problems and other constraints for development, and the role agricultural water management plays for their livelihoods. An attribute table provides a detailed description of each livelihood zone.
-
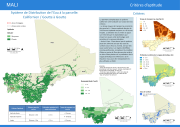
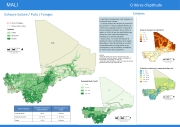
Physical suitability for Drip irrigation and low pressure irrigation systems (Californian) has been assessed on the basis of: Travel time to markets: Setting a threshold < 4 hours High suitability, 4-8 hours Medium and >8hours low we refine a bit more the suitability. Input grid: Travel time to the closest city with more than 20.000 inhabitants. (http://www.fao.org/geonetwork/srv/en/main.home?uuid=e0 8b8b0c-8c5f-44b9-bbcf-45a14db88975) Groundwater potential: An estimated Static Groundwater Level Depth has been generated by interpolating a boreholes georeferenced database provided by the Ministère de lâHydraulique du Mali.A 15 m depth threshold was stablished as the limit pumping height. Proximity to surface water (1km buffer distance)
-
Physical conservation for Soil and water conservation techniques has been assessed on the basis of slope, climate and land use. The SW conservation techniques assessed are: plantation holes, dune fixation and contour stone bunds. Slope: flat zones are considered as the most suitable for the implementation of these technologies. Rainfall: Zones with moderate to high rainfall rates (from 250mm/year) are considered favorable. Land use: Using as input the Globecover land use grid, a boolean mask has been generated to concentrate the suitability evaluation only on agricultural lands.
-
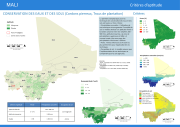
Physical conservation for small dams has been assessed on the basis of population density, water runoff and time of transportations to reach the nearest market. Average time of transport to the market: Criteria selection is based on the fact that the farms targeted for this technology are oriented towards commercialization. Runoff: areas in the band 20-150 mm / year are considered highly relevant, areas with a runoff above 150 are considered to be moderately relevant. Areas where runoff is less than 20 mm / year are assessed as unfit. Population density: a medium and low density of population is considered favorable
-
Physical suitability for Wells, boreholes and solar pumping devices Travel time to markets: Setting a threshold < 4 hours High suitability, 4-8 hours Medium and >8hours low we refine a bit more the suitability. Input grid: Travel time to the closest city with more than 20.000 inhabitants. (http://www.fao.org/geonetwork/srv/en/main.home?uuid=e0 8b8b0c-8c5f-44b9-bbcf-45a14db88975) Groundwater potential: An estimated Static Groundwater Level Depth has been generated by interpolating a boreholes georeferenced database provided by the Ministère de lâHydraulique du Mali. This factor is directly related with the suitability from an economical approach, we assume that the deeper is the static level the higher are the investment costs.
-
The actual EvapoTranspiration and Interception (ETIa) is the sum of the soil evaporation (E), canopy transpiration (T), and evaporation from rainfall intercepted by leaves (I). The value of each pixel represents the average daily ETIa in a given dekad. The data is provided in near real time from January 2009 to present.
-
The Transpiration (T) data component is the actual transpiration of the vegetation canopy. The value of each pixel represents the total annual transpiration for that specific year. The data is provided in near real time from January 2009 to present.
-
The transpiration (T) data component (dekadal, in mm/day) is the actual transpiration of the vegetation canopy. The value of each pixel represents the average daily actual transpiration for that specific dekad. The data is provided in near real time from January 2009 to present.
-
The actual EvapoTranspiration and Interception (ETIa) is the sum of the soil evaporation (E), canopy transpiration (T), and evaporation from rainfall intercepted by leaves (I). The value of each pixel represents the ETIa in a given month. The data is provided in near real time from January 2009 to present.