 FAO Map Catalog
Madagascar
Type of resources
Available actions
Topics
Keywords
Contact for the resource
Provided by
Years
Formats
Representation types
Update frequencies
status
Scale
-
Taux de déforestation annuels entre 1990-2000, 2000-2005, 2005-2010 et 2010-2013 **Table content** - Année - Région - Indicateur - Valeur - Flag - Unité
-

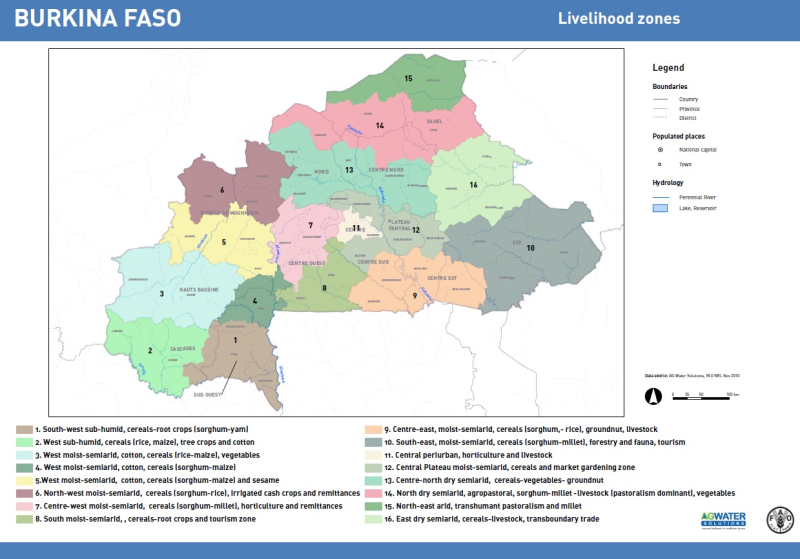
Livelihood zoning consists in identifying areas where rural people share relatively homogeneous living conditions, on the basis of a combination of biophysical and socio-economic determinants. The main criteria to establish livelihood zones are: the predominant source of income (livelihood activities); the natural resources available to people and the way they are used; and the prevailing agroclimatic conditions that influence farming activities. Patterns of livelihood vary from one area to another, based on local factors such as climate, soil or access to markets. The analysis delineates geographical areas within which people share similar livelihood patterns: source of living, access to food, farming practices, including crops, livestock and access to markets. The map of livelihood zones is the main output from a participatory mapping workshop and forms the basis for the overall AWM assessment. It describes and geographically locates the different country livelihood contexts, focusing on the main smallholdersâ livelihood strategies, their water-related problems and other constraints for development, and the role agricultural water management plays for their livelihoods. An attribute table provides a detailed description of each livelihood zone.
-

The participatory mapping process (the steps before) allowed for the gathering of national expertsâ perspectives on how and where AWM can contribute to the improvement of the lives of small-scale agricultural producers. The how, where and who are identified based on the following factors: Population density: measured as rural population in a given livelihood zone Water constraints: Expressed as percentage of rural population perceiving water (management) as the main limiting factor for agricultural production. Water availability: Expressed as the share of rural population whose water demand would be fulfilled given the current water availability in a specific area. Based on these criteria the map on the potential population that can benefit from the AWM investment options were developed. The population is presented as an absolute number (density of beneficiaries) and as a percentage of the total rural population, in order to identify within-country variations and therefore the need for context and site-specific investments and interventions.
-

Biophysical suitability of soil conservation (agroecological practices) has been assessed on the basis of slope, population density and dry period.
-

Physical conservation for drip irrigation systems has been assessed on the basis of time to reach the markets, type of soil and distance to surface water. - Access to markets: Average time to reach the closest market ( less than 4 hours is considered as highly suitable) - Access to surface water: suitable zones are the ones within a distance of 1km or less -Presence of shallow groundwater: associated to the presence of gleysols
-

-
Evolution de la couverture de forêts naturelles à Madagascar, 1990-2000-2005-2010-2013 **Table content** - Année - Région - Indicateur - Superficie - Flag - Unité **Value assigned to No-data**:NA
-
Livelihood zoning consists in identifying areas where rural people share relatively homogeneous living conditions, on the basis of a combination of biophysical and socio-economic determinants. The main criteria to establish livelihood zones are: the predominant source of income (livelihood activities); the natural resources available to people and the way they are used; and the prevailing agroclimatic conditions that influence farming activities. Patterns of livelihood vary from one area to another, based on local factors such as climate, soil or access to markets. The analysis delineates geographical areas within which people share similar livelihood patterns: source of living, access to food, farming practices, including crops, livestock and access to markets. The map of livelihood zones is the main output from a participatory mapping workshop and forms the basis for the overall AWM assessment. It describes and geographically locates the different country livelihood contexts, focusing on the main smallholdersâ livelihood strategies, their water-related problems and other constraints for development, and the role agricultural water management plays for their livelihoods. An attribute table provides a detailed description of each livelihood zone.
-
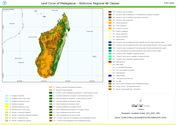
This land cover data set is derived from the original raster based Globcover regional (Africa) archive. It has been post-processed to generate a vector version at national extent with the LCCS regional legend (46 classes). This database can be analyzed in the GLCN software Advanced Database Gateway (ADG), which provides a user-friendly interface and advanced functionalities to breakdown the LCCS classes in their classifiers for further aggregations and analysis. The data set is intended for free public access. The shape file's attributes contain the following fields: -Area (sqm) -ID -Gridcode (Globcover cell value) -LCCCode (unique LCCS code) You can download a zip archive containing: -the shape file (.shp) -the ArcGis layer file with global legend (.lyr) -the ArcView 3 legend file (.avl) -the LCCS legend tables (.xls)