 FAO Map Catalog
MENA - Middle East North Africa
Type of resources
Available actions
Topics
Keywords
Contact for the resource
Provided by
Years
Formats
Representation types
Update frequencies
status
-
Surface temperature anomaly from MODIS highlighting whether conditions are warmer/cooler than usual for that month The data is published on MAWRED (Monitoring Agriculture and Water Resources during Droughts) and was generated by ICBA (International Centre for Biosaline Agriculture)
-

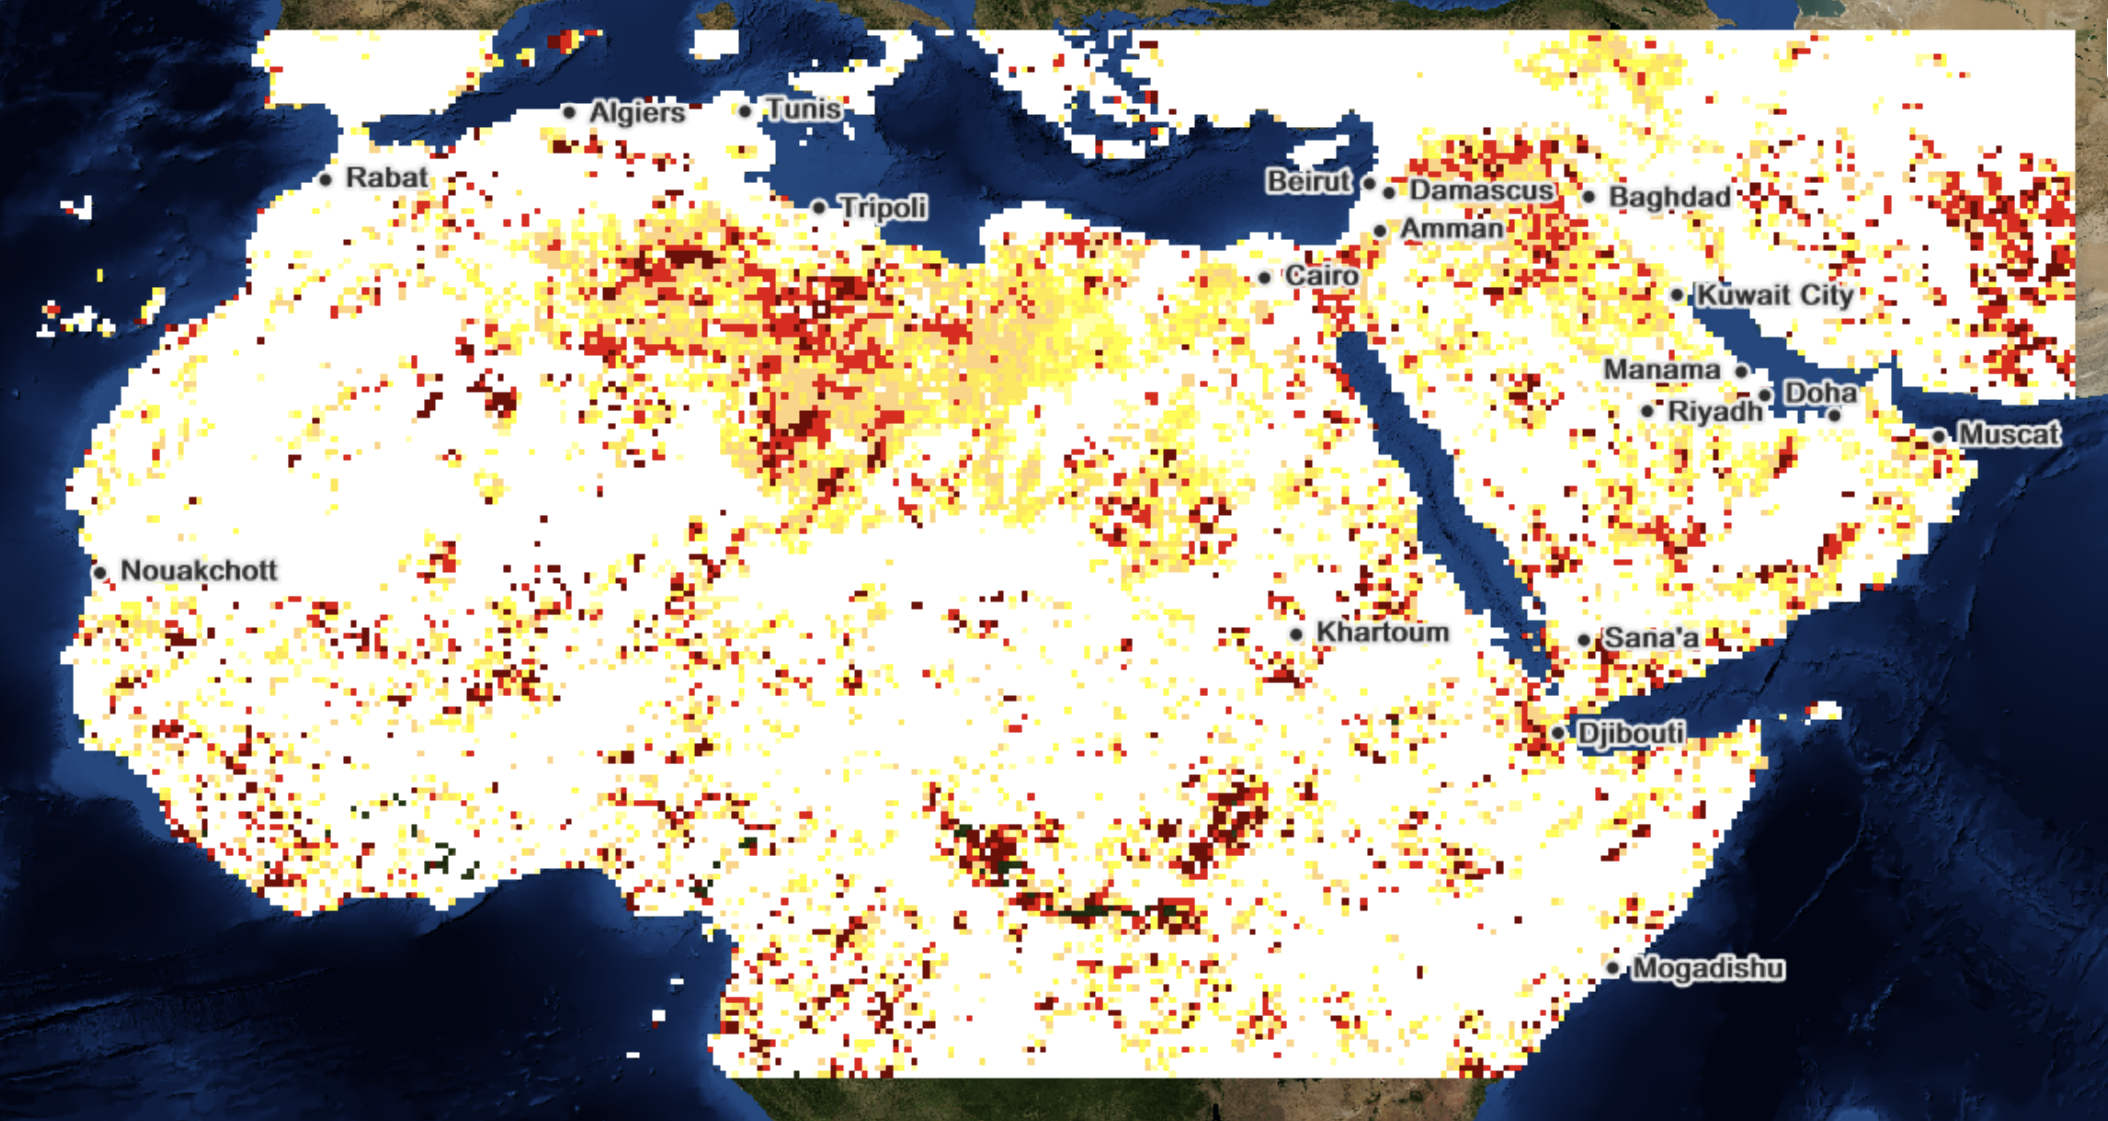
Vegetation health anomalies from the Normalized Difference Vegetation Index (NDVI) anomaly from MODIS which captures the state of stress within crops relative to average conditions for the month This indicator is assessing the vegetation health using the Normalized Difference Vegetation Index (NDVI) anomaly from MODIS which captures the state of stress within crops relative to average conditions for the month. data used to calculate the anomaly spans from February 2000 to present. For each pixel, monthly values of the NDVI are ranked into percentiles for the same month from 2000 to present. The data is published on MAWRED (Monitoring Agriculture and Water Resources during Droughts) and was generated by ICBA (International Centre for Biosaline Agriculture)
-

Soil moisture anomaly generated through the LISmodel capturing whether the rooting zone soil moisture is drier/wetter than usual for the month The data is published on MAWRED (Monitoring Agriculture and Water Resources during Droughts) and was generated by ICBA (International Centre for Biosaline Agriculture)
-

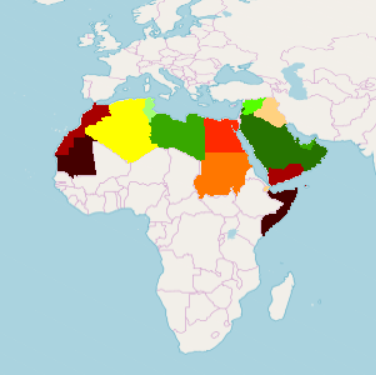
Part of the Integrated Vulnerability Assessment in the Arab Region, this 1km pixel resolution raster dataset provides a representation Vulnerability Assessment Output - Adaptive Capacity, in the Middle East and North Africa Region. Vulnerability is a concept used to express the complex interaction of climate change effects and the susceptibility of a system to its impacts. The integrated vulnerability assessment methodology is based on an understanding of vulnerability as a function of a system’s climate change exposure, sensitivity and adaptive capacity to cope with climate change effects, consistent with the approach put forward by the Intergovernmental Panel on Climate Change (IPCC) in its Fourth Assessment Report (AR4). Combining exposure, sensitivity and adaptive capacity allows assessing the vulnerability of a system to climate change. The integrated vulnerability assessment combines a series of single vulnerability assessments for several water-related climate change impacts on different sectors. Adaptive capacity Indicators were assumed to retain the same values for the reference period and future periods, and raster grid pixel values were classified according to level of Adaptive Capacity, from low 1 to high 10.
-

This raster dataset provides a representation of the change in the TAS Indicator, Annual Temperature for the Middle East and North Africa Region. The Regional Climate Model (RCM) ensemble adopts the time periods generally used by the Intergovernmental Panel for Climate Change (IPCC) and other regional climate modelling experiments. It runs climate simulations based on three future time periods that are compared with a historical reference period. Available at 50km pixel resolution, for future time periods; Near, Mid and End-century, the raster grids are generated for moderate and high representative concentration pathways (RCPs), climate change scenarios developed by the IPCC for informing global and regional climate modelling work (RCP4.5 and RCP8.5). The adopted time periods are: - Near-Century (2016-2035); - Mid-Century (2046-2065); - End-Century (2081-2100).
-

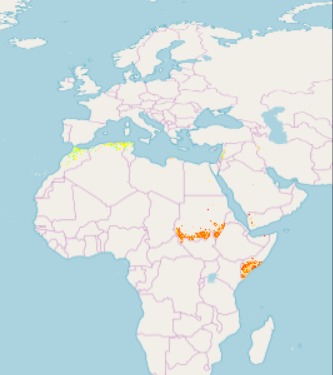
The final Composite Drought Index is a contribution of ranked drought indicators. Ranking the indicators based on percentiles helps characterizing the drought since its categories are associated with historical occurrence/likelihood (percentile ranking). Methodology The inputs that have a native grid of 0.05 deg (Rainfall, NDVI and LST) have been regridded to 0.25 deg and ranked into percentiles. All inputs are monthly except rainfall. We decided to take into account 2 months to reflect the effect of vegetation and soil lag response to a rainfall deficit or excess. The final CDI is a combination of the four inputs after attribution of individual weights to each component. The weights are attributed based on land use/land cover map provided by ESA and UCLouvain, GlobCover-L4. The data is published on MAWRED (Monitoring Agriculture and Water Resources during Droughts) and was generated by ICBA (International Centre for Biosaline Agriculture)
-

Part of the Integrated Vulnerability Assessment in the Arab Region, this 1km pixel resolution raster dataset provides a representation of future change in vulnerability for Biodiversity and Ecosystems sector, in the Middle East and North Africa Region. The Raster grid was generated for high representative concentration pathway (RCP8.5) emission scenario developed by the Intergovernmental Panel on Climate Change (IPCC), for future time period Mid-Century (2046-2065). Pixel values are classified according to level of vulnerability, from low 1 to high 10. Vulnerability is a concept used to express the complex interaction of climate change effects and the susceptibility of a system to its impacts. The integrated vulnerability assessment methodology is based on an understanding of vulnerability as a function of a system’s climate change exposure, sensitivity and adaptive capacity to cope with climate change effects, consistent with the approach put forward by the IPCC in its Fourth Assessment Report (AR4). It adopts the time periods generally used by the IPCC and other regional climate modelling experiments, and runs climate simulations based on future time periods that are compared with a historical reference period.
-
This raster dataset provides a representation of the change in Annual Evapotranspiration in the Middle East and North Africa Region. Bias-corrected Regional Climate Models (RCM) results serve as inputs for the generation of the Regional Hydrological Model (RHM) ensemble using open-source hydrological model HYPE (Hydrological Predictions for the Environment). The RHM is applied to assess hydrological change using future climate projections and can accommodate large datasets spanning timescales exceeding 100 years. The RHM ensemble adopts the time periods used by the Intergovernmental Panel for Climate Change (IPCC) and other regional climate modelling experiments. It runs climate simulations based on three future time periods that are compared with a historical reference period. Available at 0,19 degree (approx. 21km) pixel resolution, for future time periods; Near, Mid and End-century, the raster grids are generated for moderate and high representative concentration pathways (RCPs), climate change scenarios developed by the IPCC for informing global and regional climate modelling work (RCP4.5 and RCP8.5). The adopted time periods are: Near-Century (2016-2035); Mid-Century (2046-2065); End-Century (2081-2100).
-
Part of the Integrated Vulnerability Assessment in the Arab Region, this 1km pixel resolution raster dataset provides a representation of the Adaptive Capacity to climate change for the Knowledge and Awareness dimension indicator - E-Government Development - in the Middle East and North Africa Region. Vulnerability is a concept used to express the complex interaction of climate change effects and the susceptibility of a system to its impacts. The integrated vulnerability assessment methodology is based on an understanding of vulnerability as a function of a system’s climate change exposure, sensitivity and adaptive capacity to cope with climate change effects, consistent with the approach put forward by the Intergovernmental Panel on Climate Change (IPCC) in its Fourth Assessment Report (AR4). Combining exposure, sensitivity and adaptive capacity allows assessing the vulnerability of a system to climate change. Within this conceptual framework, Adaptive Capacity refers to “the ability of a system to adjust to climate change (including climate variability and extremes), to moderate potential damages, to take advantage of opportunities, or to cope with the consequences” as defined in the IPCC AR4. Adaptive Capacity was categorized into six dimensions, the Knowledge and Awareness dimension demonstrates the ability of a community to access and understand information to enable the identification of adaptation measures. The indicator is assumed to retain the same values for the reference period and future periods, and the raster grid was classified according to level of Adaptive Capacity, from low 1 to high 10.
-
Part of the Integrated Vulnerability Assessment in the Arab Region, this 1km pixel resolution raster dataset provides a representation of future change in vulnerability for Agriculture: Water Available for Livestock sub-sector, in the Middle East and North Africa Region. The Raster grid was generated for high representative concentration pathway (RCP8.5) emission scenario developed by the Intergovernmental Panel on Climate Change (IPCC), for time period End-Century (2081-2100). Pixel values are classified according to level of vulnerability, from low 1 to high 10. Vulnerability is a concept used to express the complex interaction of climate change effects and the susceptibility of a system to its impacts. The integrated vulnerability assessment methodology is based on an understanding of vulnerability as a function of a system’s climate change exposure, sensitivity and adaptive capacity to cope with climate change effects, consistent with the approach put forward by the IPCC in its Fourth Assessment Report (AR4). It adopts the time periods generally used by the IPCC and other regional climate modelling experiments, and runs climate simulations based on future time periods that are compared with a historical reference period.