 FAO Map Catalog
Kenya
Type of resources
Available actions
Topics
Keywords
Contact for the resource
Provided by
Years
Formats
Representation types
Update frequencies
status
Scale
Resolution
-
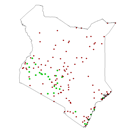
This dataset contains information on the apparent density of tsetse flies in three selected areas of Kenya (Lambwe Valley, Lake Bogoria and Meru/Mwea). It was genereated within the framework of a tsetse and trypanosomiasis elimination campaign (Pan-African tsetse and trypanosomiasis eradication campaign (PATTEC) - Kenya).
-
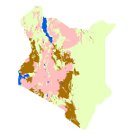
This dataset is for Rift Valley Fever project which was used as the structuring of the geospatial data. The World Health Organization (WHO) initiated the Expanded Program on Immunization (EPI) in May 1974 with the objective to vaccinate children throughout the world. In each of the United Nations’ member states, the national governments create and implement their policies for vaccination programs following the guidelines set by the EPI. Rift Valley fever (RVF) is an acute viral disease that affects domestic animals (such as cattle, buffalo, sheep, goats, and camels). The disease is caused by the RVF virus, generally found in regions of eastern and southern Africa, but also in most countries of sub-Saharan Africa, Madagascar, Saudi Arabia and Yemen. This dataset represents the administrative boundaries of Kenya, Tanzania and Uganda. The dataset was edited by FAO-CSI for topology/geometry validation in January,2022. International borders were updated/validated against the official/recognized borders from the United Nations Geospatial Information Section (UN-map 2018).
-
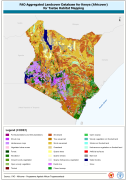
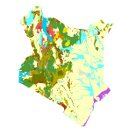
This dataset is an aggregated version of the original national Africover landcover multipurpose database. A 26-class legend is used to aggregate the classes present in the original full resolution, multipurpose landcover database. A single legend is applicable to the eight trypanosomiasis-affected countries mapped during Africover project (Burundi, Democratic Republic of the Congo, Kenya, Rwanda, Somalia, Sudan, Uganda and United Republic of Tanzania).
-
The full resolution dataset of towns was developed from data from the National Imagery and Mapping Agency (NIMA).
-

The full resolution dataset of landform and lithology has been produced from visual interpretation of digitally enhanced LANDSAT TM images acquired mainly in the year 1995. The landform classes have been developed using the ITC (International Institute for Geo-Information Science and Earth Observation) and SOTER (Soil and Terrain Database) methods. The structure of the derived legend follows a specific criteria that allows an easy correlation between these classes and the standardised one listed in LCCS (SOTER classification first and second level). SOTER is a pure Parametric or Morphometric classification. The main origin or process of terrain units is an important descriptive element because it realtes to the dominant exogenous or endogenous processes. this aspect in a general classification gives a meaningful grouping and has analytical value. The proposed legend is structured in such a way that it can be read, not only from the Morphometric point of view as in SOTER, but also taking into account the main origin and the age of landforms (mainly derived from the lithology legend). Lithology is linked with the mapping units, but is listed seperately. See the full landform/lithology legend in the resource section.
-
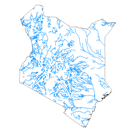
The full resolution dataset of rivers was produced from visual interpretation of digitally enhanced LANDSAT TM images (Bands 4,3,2) acquired mainly in the year 1995.
-
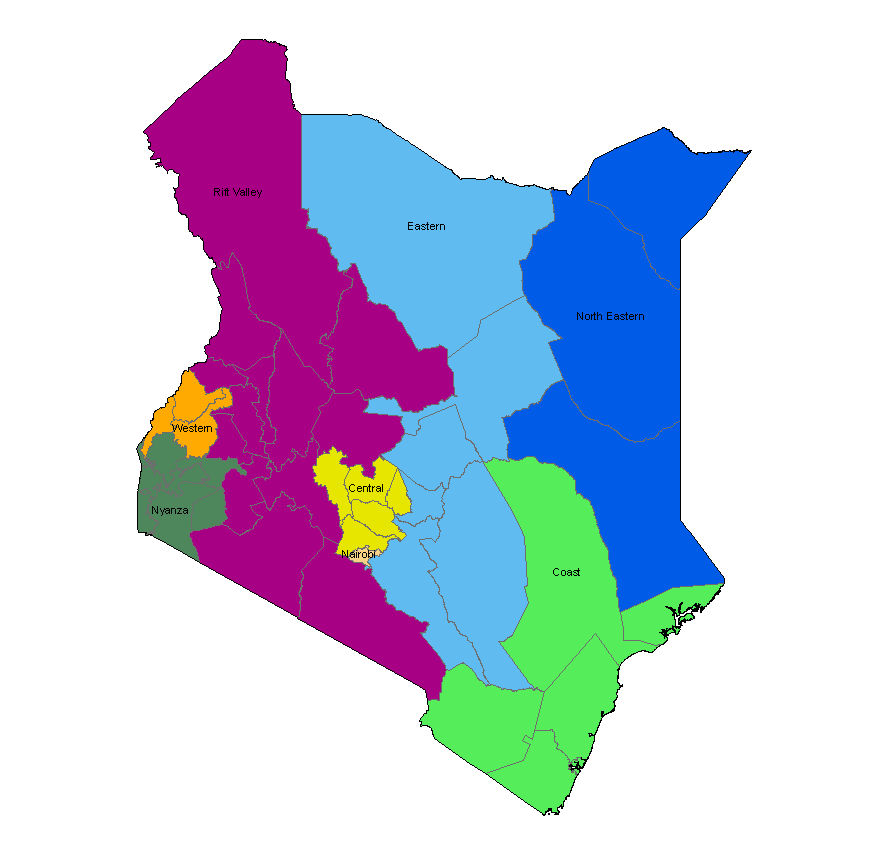
The national and administrative boundaries have been provided by the NFPI. Coastlines have been adapted to match the landcover dataset.
-
This is a thematic aggregation of the original full resolution Geomorphology/Landform and Lithology database which has been produced from visual interpretation of digitally enhanced LANDSAT TM images acquired mainly in the year 1997. The landform classes have been developed using the ITC (International Institute for Geo-Information Science and Earth Observation) and SOTER (Soil and Terrain Database) methods. This thematic aggregation groups the landform codes into broader landform units. The structure of the derived legend follows a specific criteria that allows and easy correlation between these classes and the standardised one listed in LCCS (SOTER classification first and second level). SOTER is a pure Parametric or Morphometric classification. The main origin or process of terrain units is an important descriptive element because it relates to the dominant exogenous or endogenous processes. This aspect in a general classification gives a meaningful grouping and has analytical value. The proposed legend is structured in such a way that it can be read, not only from the Morphometric point of view as in SOTER, but also taking into account the main origin and the age of landforms (mainly derived from the lithology legend). Lithology is linked with the mapping units, but is listed separately. See the full landform/lithology legend in the resource section.
-

Raster grid covering the country with 0.01 decimal degrees resolution produced under the scope of the sub-Saharan African Corridor project pilot case, using raster-based Geographical Information Systems - Multicriteria Decision Analysis (GIS-MCDA) methodology for the identification and definition of mobile storage locations (movable warehouses). The modeling variables characterize supply, demand and accessibility, main logistical factors for warehousing facilities location. These variables are major crops (supply), human population density (demand) and main transportation network infrastructure (accessibility). The main transportation network infrastructure is the input for the development of a raster-based travel time/cost analysis. GIS multicriteria decision analysis GIS-MCDA consists of a method to convert and combine spatial data/geographical information and decision-makers criteria in order to attain evidence for a decision-making process. The location score is obtained by way of a simple arithmetic weighted sum calculation (raster calculator tool) of reclassified grids, generating a location score varying from 0 to 3. The assumed weight for each of the criteria is as follows. ("Crop Production" * 0.4) + ("Human Population Density" * 0.3) + ("Cumulative Travel Time/Cost" * 0.3)
-
This is a thematic aggregation of the original full resolution Geomorphology/Landform and Lithology database which has been produced from visual interpretation of digitally enhanced LANDSAT TM images acquired mainly in the year 1995. The landform classes have been developed using the ITC (International Institute for Geo-Information Science and Earth Observation) and SOTER (Soil and Terrain Database) methods. This thematic aggregation groups the lithology codes into three main groupings based on geological origin (i.e. Igneous, sedimentary or metamorphic). The structure of the derived legend follows a specific criteria that allows and easy correlation between these classes and the standardised one listed in LCCS (SOTER classification first and second level). SOTER is a pure Parametric or Morphometric classification. The main origin or process of terrain units is an important descriptive element because it relates to the dominant exogenous or endogenous processes. This aspect in a general classification gives a meaningful grouping and has analytical value. The proposed legend is structured in such a way that it can be read, not only from the Morphometric point of view as in SOTER, but also taking into account the main origin and the age of landforms (mainly derived from the lithology legend). Lithology is linked with the mapping units, but is listed separately. See the full landform/lithology legend in the resource section.