 FAO Map Catalog
HiH_GIS_LAB
Type of resources
Available actions
Topics
Keywords
Contact for the resource
Provided by
Formats
Representation types
Update frequencies
status
Scale
-

This data set depicts the distribution of marginal areas by administrative zones in Santiago, Cape Verde, according to a Marginality Index methodology. The Marginality Index measures the incidence of food insecurity and poverty (FIP) among the households living in each area. The index is created as a function of the most relevant variables of the year 2000 Demographic Census, using the principal components methodology. Areas with an index score above a selected threshold level have been classified as vulnerable. The boundaries of administrative zones were digitized from scanned and rectified topographic maps (Carta Militar de Portugal, Ilha de Santiago 1969).
-
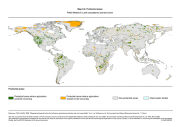
The FGGD protected areas map is a global raster datalayer with a resolution of 5 arc-minutes. Each pixel is classified as protected area where agriculture should not be occurring, protected area where agriculture could be occurring, or non-protected area. The data are taken from the UNEP-WCMC World database on protected areas, 2003.
-
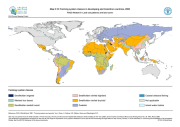
The FGGD farming system classes map is a global raster datalayer with a resolution of 5 arc-minutes. Each pixel is classified as belonging to one of seven farming system classes, aggregated from the original 45 farming systems contained in the farming systems map. The data are taken from regional maps generated for inclusion in FAO and World Bank, 2001, Farming systems and poverty, by J. Dixon et al.
-

The development of the 2020 national land cover map of Sudan is an important step towards the REDD+ readiness as well as Sudan’s Forest Monitoring System (SFMS). The 2020 land cover map has been developed using 10 m spatial resolution, open-source satellite data, employing an object-based classification approach. The processing was implemented in the Google Earth Engine (GEE), cloud computing environment using 10 m spatial resolution Sentinel-1 and Sentinel-2 data. Use of GEE leverages the use of terabytes of satellite imagery and geospatial datasets. The workflow is mostly reproducible and based on the use of open-source software/platforms (e.g., R, SEPAL, etc.). The methodological approach for land cover mapping takes into consideration the time constraint of the project and comparative advantage and respective technical expertise of FAO and Forests National Corporation (FNC). Descriptions of the legend classes were translated using the land cover classification system (LCCS v3) – an implementation tool of the ISO standard (ISO 19144-2) Land Cover Meta Language (LCML). You can download a zip archive containing: -the shape file in gdb file -legends in lccs file
-

This land cover database has been produced after the Ketsana Typhoon that hit Laos in September 28, 2009. Land cover monitoring and assessment is essential for the sustainable management of natural resources, environmental protection, food security, and of course for measuring the impact and extent of natural disasters. Commissioned by the Lao FAOREP, the GIS and RS group of the FAO NR Department has conducted a quick interpretation of historical satellite imagery (Landsat ETM from the Global Land Survey archive), dated around 2000, according to procedures, methodologies and tools established by the Global Land Cover Network (GLCN) programme. The LCCS approach was adopted to classify the land cover.
-

The map summarizes the status of the land use and land cover at global scale. It was compiled according to the current GAEZ (Global Agro-Ecological Zones) -2009 approach, developed by FAO in collaboration with IIASA (International Institute for Applied Systems Analysis).The current Global AEZ (GAEZ-2009) offers a standardized framework for the characterization of climate, soil and terrain conditions relevant to agricultural production, which can be applied at global to sub-national levels. The map is based on six geographic datasets: - GLC2000 land cover database at 30 arc-sec (http://www-gvm.jrc.it/glc2000), using regional and global legends (JRC, 2006); - an IFPRI global land cover categorization providing 17 land cover classes at 30 arc-sec. (IFPRI, 2002), based on a reinterpretation of the Global Land Cover Characteristics Database (GLCC ver. 2.0), EROS Data Centre (EDC, 2000); - FAO’s Global Forest Resources Assessment 2000 and 2005 (FAO, 2001; FAO, 2006) at 30 arc-sec. resolution; - digital Global Map of Irrigated Areas (GMIA) version 4.0 of (FAO/University of Frankfurt) at 5’ by 5’ latitude/longitude resolution, providing by grid-cell the percentage land area equipped with irrigation infrastructure (Siebert et al., 2007); - a spatial population density inventory (30-arc seconds) for year 2000 developed by FAO-SDRN, based on spatial data of LANDSCAN 2003, with calibration to UN 2000 population figures. An iterative calculation procedure has been implemented to estimate land cover class weights, consistent with aggregate FAO land statistics and spatial land cover patterns obtained from remotely sensed data, allowing the quantification of major land use/land cover shares in individual 5’ by 5’ latitude/longitude grid cells.
-
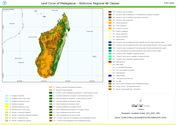
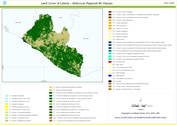
This land cover data set is derived from the original raster based Globcover regional (Africa) archive. It has been post-processed to generate a vector version at national extent with the LCCS regional legend (46 classes). This database can be analyzed in the GLCN software Advanced Database Gateway (ADG), which provides a user-friendly interface and advanced functionalities to breakdown the LCCS classes in their classifiers for further aggregations and analysis. The data set is intended for free public access. The shape file's attributes contain the following fields: -Area (sqm) -ID -Gridcode (Globcover cell value) -LCCCode (unique LCCS code) You can download a zip archive containing: -the shape file (.shp) -the ArcGis layer file with global legend (.lyr) -the ArcView 3 legend file (.avl) -the LCCS legend tables (.xls)
-

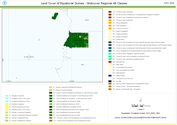
This land cover data set is derived from the original raster based Globcover regional (Africa) archive. It has been post-processed to generate a vector version at national extent with the LCCS regional legend (46 classes). This database can be analyzed in the GLCN software Advanced Database Gateway (ADG), which provides a user-friendly interface and advanced functionalities to breakdown the LCCS classes in their classifiers for further aggregations and analysis. The data set is intended for free public access. The shape file's attributes contain the following fields: -Area (sqm) -ID -Gridcode (Globcover cell value) -LCCCode (unique LCCS code) You can download a zip archive containing: -the shape file (.shp) -the ArcGis layer file with global legend (.lyr) -the ArcView 3 legend file (.avl) -the LCCS legend tables (.xls)
-
This land cover data set is derived from the original raster based Globcover regional (Africa) archive. It has been post-processed to generate a vector version at national extent with the LCCS regional legend (46 classes). This database can be analyzed in the GLCN software Advanced Database Gateway (ADG), which provides a user-friendly interface and advanced functionalities to breakdown the LCCS classes in their classifiers for further aggregations and analysis. The data set is intended for free public access. The shape file's attributes contain the following fields: -Area (sqm) -ID -Gridcode (Globcover cell value) -LCCCode (unique LCCS code) You can download a zip archive containing: -the shape file (.shp) -the ArcGis layer file with global legend (.lyr) -the ArcView 3 legend file (.avl) -the LCCS legend tables (.xls)