 FAO Map Catalog
Exposure Indicators
Type of resources
Available actions
Topics
Keywords
Provided by
Years
Formats
Representation types
Update frequencies
status
-
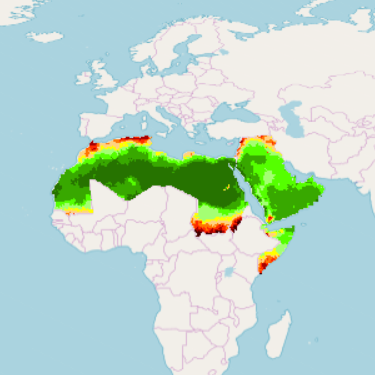
RICCAR, MENA Region - Vulnerability Assessment Exposure Indicators (HYPE RHM Output - Reference Period) This raster dataset provides a representation of the exposure indicators derived from hydrological model Hydrological Predictions for the Environment (HYPE) in the Middle East and North Africa Region, for the reference period 1986-2005. In the context of climate change, exposure refers to changes in climate parameters that might affect socio-ecological systems. Using on the open-source hydrological model HYPE and bias-corrected Regional Climate Models (RCM) results as inputs, the Regional Hydrological Model (RHM) ensemble is employed to assess hydrological change based on future climate projections. The RHM ensemble adopts the same time periods used by the Intergovernmental Panel for Climate Change (IPCC) and other regional climate modelling experiments. It runs climate simulations based on three future time periods that are compared with a historical reference period. Available at approximately 1km pixel resolution, for 1986-2005 reference period, the raster grids are generated for moderate and high representative concentration pathways (RCPs), emission scenarios developed by the IPCC for informing global and regional climate modelling work (RCP4.5 and RCP8.5). Grid pixel values are classified according to a level of exposure (1 to 10), for the indicators, Evapotranspiration and Runoff.
-
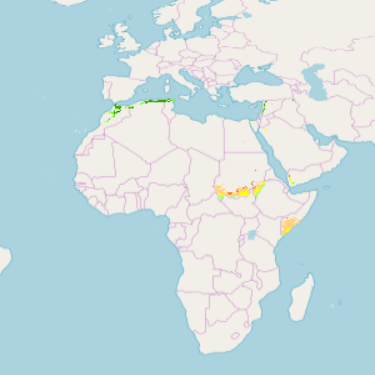
This raster grid provides a representation of the exposure (vulnerability assessment) for climate change impact sector:subsector – Biodiversity and Ecosystems: Area Covered by Forests - in the Middle East and North Africa Region, 1986-2005 reference period. Vulnerability is a concept used to express the complex interaction of climate change effects and the susceptibility of a system to its impacts. In the context of climate change, exposure refers to changes in climate parameters that might affect socio-ecological systems. The integrated vulnerability assessment combines a series of single vulnerability assessments for several water-related climate change impacts on different sectors. It adopts the time periods generally used by the Intergovernmental Panel for Climate Change (IPCC) and other regional climate modelling experiments, and runs climate simulations based on future time periods that are compared with a historical reference period. The raster grid (GeoTiff raster file) is available for 1986-2005 reference period at approximately 1km pixel resolution. Pixel values were classified according to level of exposure, from low 1 to high 10, for the sector:subsector: Biodiversity and Ecosystems: Area Covered by Forests.
-
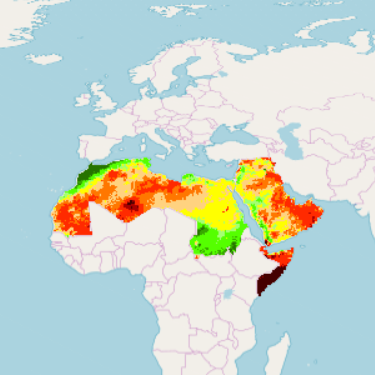
This raster dataset provides a representation of future levels of exposure for the indicators derived from hydrological model Variable Infiltration Capacity (VIC), in the Middle East and North Africa Region. In the context of climate change, exposure refers to changes in climate parameters that might affect socio-ecological systems. The Regional Hydrological Model (RHM) ensemble using on the open-source hydrological model VIC is applied to assess hydrological change based on future climate projections. Bias-corrected Regional Climate Models (RCM) results serve as inputs. The RHM adopts the time periods generally used by the Intergovernmental Panel for Climate Change (IPCC) and other regional climate modelling experiments. It runs climate simulations based on three future time periods that are compared with a historical reference period. Available at approximately 1km pixel resolution, for future time periods; Near, Mid and End-century, the raster grids are generated for moderate and high representative concentration pathways (RCPs), emission scenarios developed by the IPCC for informing global and regional climate modelling work (RCP4.5 and RCP8.5). Grid pixel values are classified according to a level of exposure (1 to 10), for the indicators, Evapotranspiration and Runoff. The adopted time periods are: Near-Century (2016-2035); Mid-Century (2046-2065); End-Century (2081-2100).
-

This raster grid provides a representation of the exposure (vulnerability assessment) for climate change impact sector:subsector – People: Water Available for Drinking - in the Middle East and North Africa Region, 1986-2005 reference period. Vulnerability is a concept used to express the complex interaction of climate change effects and the susceptibility of a system to its impacts. In the context of climate change, exposure refers to changes in climate parameters that might affect socio-ecological systems. The integrated vulnerability assessment combines a series of single vulnerability assessments for several water-related climate change impacts on different sectors. It adopts the time periods generally used by the Intergovernmental Panel for Climate Change (IPCC) and other regional climate modelling experiments, and runs climate simulations based on future time periods that are compared with a historical reference period. The raster grid (GeoTiff raster file) is available for 1986-2005 reference period at approximately 1km pixel resolution. Pixel values were classified according to level of exposure, from low 1 to high 10, for the sector:subsector: People: Water Available for Drinking.
-
Part of the Integrated Vulnerability Assessment in the Arab Region, this 1km pixel resolution raster dataset provides a representation of Potential Impact to climate change for impact sector:subsector – Infrastructure and Human Settlements: Inland Flooding Area - in the Middle East and North Africa Region, 1986-2005 reference period. Vulnerability is a concept used to express the complex interaction of climate change effects and the susceptibility of a system to its impacts. Within climate the vulnerability assessment conceptual framework, Exposure refers to changes in climate parameters that might affect socio-ecological systems, Sensitivity provides information about the status quo of the physical and natural environment that makes the affected systems particularly susceptible, and Potential Impact is determined by combining the exposure and sensitivity of a system. The integrated vulnerability assessment combines a series of single vulnerability assessments for several water-related climate change impacts on different sectors. It adopts the time periods generally used by the Intergovernmental Panel for Climate Change (IPCC) and other regional climate modelling experiments, and runs climate simulations based on future time periods that are compared with a historical reference period. The raster grid (GeoTiff raster file) is available for 1986-2005 reference period, with classified pixel values, from low Potential Impact 1 to high Potential Impact 10.
-

This raster dataset provides a representation of the change in exposure (vulnerability assessment) for climate change impact sector:subsector - Biodiversity and Ecosystems: Area Covered by Wetlands - in the Middle East and North Africa Region. Vulnerability is a concept used to express the complex interaction of climate change effects and the susceptibility of a system to its impacts. In the context of climate change, exposure refers to changes in climate parameters that might affect socio-ecological systems. The integrated vulnerability assessment combines a series of single vulnerability assessments for several water-related climate change impacts on different sectors. It adopts the time periods generally used by the Intergovernmental Panel for Climate Change (IPCC) and other regional climate modelling experiments, and runs climate simulations based on future time periods that are compared with a historical reference period. The adopted future time periods are: Mid-Century (2046-2065); End-Century (2081-2100). Available at approximately 1km pixel resolution, the raster grids are generated for moderate and high representative concentration pathways (RCPs), emission scenarios developed by the Intergovernmental Panel on Climate Change (IPCC) for informing global and regional climate modelling work (RCP4.5 and RCP8.5). Grid pixel values are classified according to a level of exposure (1 to 10), for the sector-subsector: - Biodiversity and Ecosystems: Area Covered by Wetlands;
-

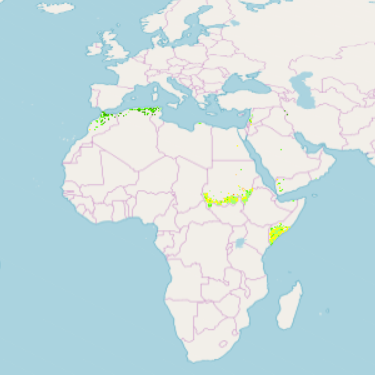
This raster grid provides a representation of the exposure (vulnerability assessment) for climate change impact sector:subsector – Biodiversity and Ecosystems: Area Covered by Wetlands - in the Middle East and North Africa Region, 1986-2005 reference period. Vulnerability is a concept used to express the complex interaction of climate change effects and the susceptibility of a system to its impacts. In the context of climate change, exposure refers to changes in climate parameters that might affect socio-ecological systems. The integrated vulnerability assessment combines a series of single vulnerability assessments for several water-related climate change impacts on different sectors. It adopts the time periods generally used by the Intergovernmental Panel for Climate Change (IPCC) and other regional climate modelling experiments, and runs climate simulations based on future time periods that are compared with a historical reference period. The raster grid (GeoTiff raster file) is available for 1986-2005 reference period at approximately 1km pixel resolution. Pixel values were classified according to level of exposure, from low 1 to high 10, for the sector:subsector: Biodiversity and Ecosystems: Area Covered by Wetlands.
-
This raster dataset provides a representation of the change in exposure (vulnerability assessment) for climate change impact sector:subsector - Biodiversity and Ecosystems: Area Covered by Forests - in the Middle East and North Africa Region. Vulnerability is a concept used to express the complex interaction of climate change effects and the susceptibility of a system to its impacts. In the context of climate change, exposure refers to changes in climate parameters that might affect socio-ecological systems. The integrated vulnerability assessment combines a series of single vulnerability assessments for several water-related climate change impacts on different sectors. It adopts the time periods generally used by the Intergovernmental Panel for Climate Change (IPCC) and other regional climate modelling experiments, and runs climate simulations based on future time periods that are compared with a historical reference period. The adopted future time periods are: Mid-Century (2046-2065); End-Century (2081-2100). Available at approximately 1km pixel resolution, the raster grids are generated for moderate and high representative concentration pathways (RCPs), emission scenarios developed by the Intergovernmental Panel on Climate Change (IPCC) for informing global and regional climate modelling work (RCP4.5 and RCP8.5). Grid pixel values are classified according to a level of exposure (1 to 10), for sector:subsector: - Biodiversity and Ecosystems: Area Covered by Forests;
-

This raster dataset provides a representation of the change in exposure (vulnerability assessment) for climate change impact sector:subsector - Infrastructure and Human Settlements: Inland Flooding Area - in the Middle East and North Africa Region. Vulnerability is a concept used to express the complex interaction of climate change effects and the susceptibility of a system to its impacts. In the context of climate change, exposure refers to changes in climate parameters that might affect socio-ecological systems. The integrated vulnerability assessment combines a series of single vulnerability assessments for several water-related climate change impacts on different sectors. It adopts the time periods generally used by the Intergovernmental Panel for Climate Change (IPCC) and other regional climate modelling experiments, and runs climate simulations based on future time periods that are compared with a historical reference period. The adopted future time periods are: Mid-Century (2046-2065); End-Century (2081-2100). Available at approximately 1km pixel resolution, the raster grids are generated for moderate and high representative concentration pathways (RCPs), emission scenarios developed by the Intergovernmental Panel on Climate Change (IPCC) for informing global and regional climate modelling work (RCP4.5 and RCP8.5). Grid pixel values are classified according to a level of exposure (1 to 10), for the sector:subsector: - Infrastructure and Human Settlements: Inland Flooding Area;
-

RICCAR, MENA Region - Vulnerability Assessment Exposure Indicators (HYPE RHM Output - Future) This raster dataset provides a representation of future levels of exposure for the indicators derived from hydrological model Hydrological Predictions for the Environment (HYPE), in the Middle East and North Africa Region. In the context of climate change, exposure refers to changes in climate parameters that might affect socio-ecological systems. Using on the open-source hydrological model HYPE and bias-corrected Regional Climate Models (RCM) results as inputs, the Regional Hydrological Model (RHM) ensemble is employed to assess hydrological change based on future climate projections. The RHM ensemble adopts the same time periods used by the Intergovernmental Panel for Climate Change (IPCC) and other regional climate modelling experiments. It runs climate simulations based on three future time periods that are compared with a historical reference period. Available at approximately 1km pixel resolution, for future time periods; Near, Mid and End-century, the raster grids are generated for moderate and high representative concentration pathways (RCPs), emission scenarios developed by the IPCC for informing global and regional climate modelling work (RCP4.5 and RCP8.5). Grid pixel values are classified according to a level of exposure (1 to 10), for the indicators, Evapotranspiration and Runoff. The adopted time periods are: Near-Century (2016-2035); Mid-Century (2046-2065); End-Century (2081-2100).