 FAO Map Catalog
ZIP
Type of resources
Available actions
Topics
Keywords
Contact for the resource
Provided by
Years
Formats
Representation types
Update frequencies
status
Scale
-

A general characterization of moisture conditions is achieved through the concept of length of growing period (LGP), i.e. the period during the year when both moisture availability and temperature are conducive to crop growth. Thus, in a formal sense, LGP refers to the number of days within the period of temperatures above 5°C when moisture conditions are considered adequate. Under rain-fed conditions, the begin of the LGP is linked to the start of the rainy season. For establishing crops, 0.4 - 0.5 times the level of reference evapotranspiration is considered sufficient to meet water requirements of dryland crops (FAO 1978-81a; 1979; 1992a). This layer is a result of the Agro-ecological Zones (AEZ) methodology for land productivity assessments and is part of the Global Agro-ecological Zoning Database.
-
Aggregated landcover database for United Republic of Tanzania (Africover) for tsetse habitat mapping
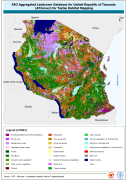
This dataset is an aggregated version of the original national Africover landcover multipurpose database. A 26-class legend is used to aggregate the classes present in the original full resolution, multipurpose landcover database. A single legend is applicable to the eight trypanosomiasis-affected countries mapped during Africover project (Burundi, Democratic Republic of the Congo, Kenya, Rwanda, Somalia, Sudan, Uganda and United Republic of Tanzania).
-
The full resolution dataset of landform and lithology has been produced from visual interpretation of digitally enhanced LANDSAT TM images acquired mainly in the year 1999. The landform classes have been developed using the ITC (International Institute for Geo-Information Science and Earth Observation) and SOTER (Soil and Terrain Database) methods. The structure of the derived legend follows a specific criteria that allows an easy correlation between these classes and the standardised one listed in LCCS (SOTER classification first and second level). SOTER is a pure Parametric or Morphometric classification. The main origin or process of terrain units is an important descriptive element because it realtes to the dominant exogenous or endogenous processes. this aspect in a general classification gives a meaningful grouping and has analytical value. The proposed legend is structured in such a way that it can be read, not only from the Morphometric point of view as in SOTER, but also taking into account the main origin and the age of landforms (mainly derived from the lithology legend). Lithology is linked with the mapping units, but is listed seperately. See the full landform/lithology legend in the resource section.
-

Global Map of Irrigation Areas - Version 5 Grid with percentage of area equipped for irrigation with a spatial resolution of 5 arc minutes or 0.083333 decimal degrees. This dataset is developed in the framework of the AQUASTAT Programme of the Land and Water Division of the Food and Agriculture Organization of the United Nations and the Rheinische Friedrich-Wilhems University, Germany. The map shows the amount of area equipped for irrigation around the year 2005 in percentage of the total area on a raster with a resolution of 5 minutes. Additional map layers show the percentage of the area equipped for irrigation that was actually used for irrigation and the percentages of the area equipped for irrigation that was irrigated with groundwater, surface water or non-conventional sources of water. In details, the following products have been released and made available for download: (A) Area equipped for irrigation expressed as percentage of total area: total=aei, surface water=aeisw, groundwater=aeigw, non-conventional sources of water=aeinc (ASCII-grid); (B) Area actually irrigated expressed as percentage of area equipped for irrigation (ASCII-grid); (C) Area equipped for irrigation expressed in hectares per cell (ASCII-grid); (D) Irrigated areas v.5 (ESRI shapefile); (E) High and low resolution images (PDF); (F) Quality Assessment (Excel) Due to the map generation method, the quality of the map can never be uniform. The overall quality of the map depends heavily on the individual quality of the data for the different countries.