 FAO Map Catalog
10000000
Type of resources
Available actions
Topics
Keywords
Contact for the resource
Provided by
Years
Formats
Representation types
Update frequencies
status
Scale
-
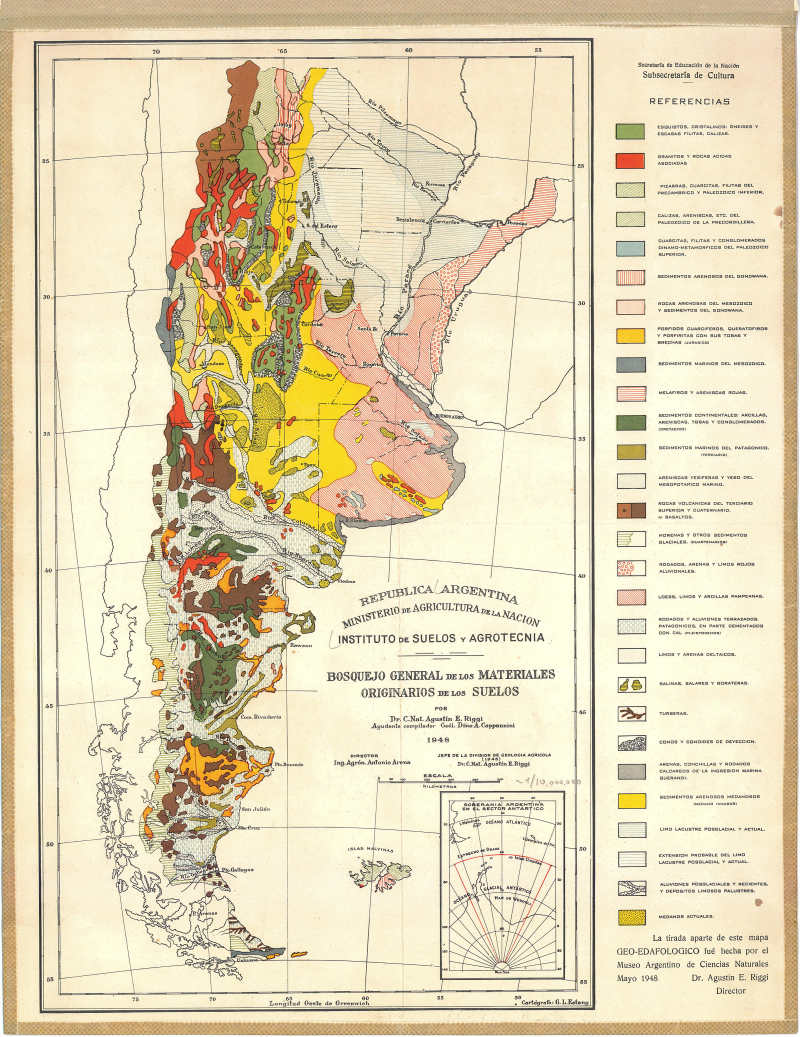
Bosquejo general de los materiales originarios de los suelos (Geological Map)
-
Include: Precambrian cratonic areas, mobile belts and sedimentary covers (Map 1), Palaeozoic and Gondwana sequences (Map 2), Post-Gondwana sequences (Map 3), Alkaline complexes and kimberlites (Map 4).
-

Map showing 8 major climate classes for Africa. Digital version of "Major Climatic Divisions" derived from the Agro-Ecological Zones Project, made by FAO in 1978. Refer to World Soil Resources Report 48, Vol. 1 Methodology and Results for Africa.
-
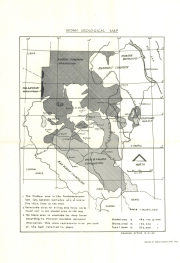
Sudan Geological map-
-

The Climate Change ATLAS (CSIC) provides climate change information for essential climate variables generated from CMIP and CORDEX international initiatives. The data cubes for CMIP5 temperature projectons provide gridded projections with a 2 deg spatial resolution as 1) differences for three reference future periods (2021-2040, 2041-2060, 2080-2100) for RCP 2.6 an 8.5 scenarios with respect to the baseline reference period 1981-2010, and 2) differences corresponding to three Global Warming Levels (1.5, 2 and 3 degC, obtained from the RCP8.5 scenario), with respect to preindustrial values (as characterized by the 1850-1900 period). Geospatial data from the ensemble of CMIP5 models represents the ensemble mean. The list of models used is available at https://github.com/SantanderMetGroup/ATLAS/tree/master/AtlasHub-inventory
-
ASSOD (1997) is a follow-up activity of GLASOD. The same methodology was used at a more detailed scale (1:5M) for South and Southeast Asia. The GLASOD methodology was slightly refined. © ISRIC,FAO,UNEP, 1997
-
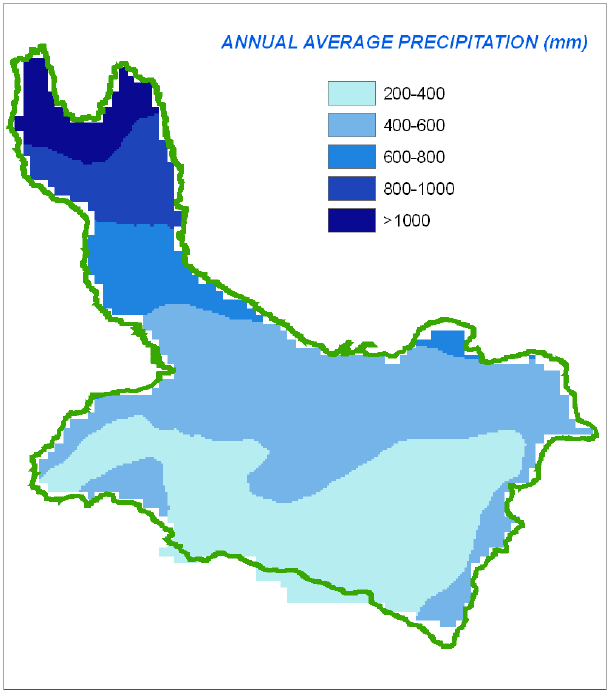
A set of 13 raster layers representing the monthly and annual, average precipitation for the Okavango Rive Basin. Source: Africa Water Resources Database (FAO). This dataset is part of the GIS Database for the Environment Protection and Sustainable Management of the Okavango River Basin project (EPSMO). Detailed information on the database can be found in the “GIS Database for the EPSMO Project†document produced by Luis Veríssimo (FAO consultant) in July 2009, and here available for download.
-
The dataset contains the predicted areas of suitability for five tsetse fly species (morsitans, pallidipes, austeni, brevipalpis and swynnertoni). All of the distributions have been produced using variations of the same methodology - by modelling the "known" presence and absence of the flies (usually the 1977 Ford and Katondo maps modified with more recent information collected from national and international agencies and researchers). The modelling process relies on logistic regression of fly presence against a wide range of predictor variables for a large number of regularly spaced sample points for each area. The predictor variables include remotely sensed (satellite image) surrogates of climate - vegetation, temperature, moisture - which have been subjected to Fourier processing to provide an additional set of season and timing related measures for each parameter. Demographic, topographic and agroecological predictors are also used. These models are then applied to the predictor imagery to determine the predicted areas of suitability for tsetse. Data are provided at 1 kilometre resolution. The maps were produced in May 2003 for FAO/IAEA Joint Division by Environmental Research Group Oxford (ERGO Ltd) in collaboration with the Trypanosomosis and Land Use in Africa (TALA) research group.
-
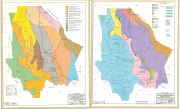
Include: Mapa de grandes grupos de suelos (FAO) del Edo. de Chihuahua (1000000), Clasificacion de suelos del Edo. de Chihuahua, sistema 7a aproximacion (primer intento) (1 000 000), Mapa de areas afectados por salinidad (5 000 000)
-
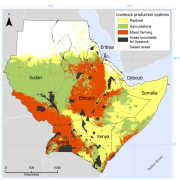
The dataset provides the distribution of pastoral, agro-pastoral and mixed farming systems in six countries of East Africa (Djibouti, Eritrea, Ethiopia, Kenya, Somalia, Sudan and Uganda). The production systems are defined according to the ratio of livestock- to crop-derived income. If L is defined as the total household income derived from livestock and C as the total household income derived from crops, then for pastoral production systems: L/C > 4; for agro-pastoral systems: 1 < L/C < 4; and for mixed farming systems L/C < 1. The map is based on datasets collected in the framework of livelihood analysis in the period 2000 and 2007. Input data were available for Djibouti, Eritrea, Kenya, Somalia, Uganda and parts of Ethiopia and Sudan. Data on these countries and regions provided the training data for the subsequent statistical analysis based on environmental and other geospatial predictors, which resulted in a full regional map. More detailed information on this datasets is available in “Geographic distribution and environmental characterization of livestock production systems in Eastern Africaâ€, 2009. Agriculture, Ecosystems & Environment, 135, 98-110.