 FAO Map Catalog
climatologyMeteorologyAtmosphere
Type of resources
Available actions
Topics
Keywords
Contact for the resource
Provided by
Years
Formats
Representation types
Update frequencies
status
Scale
Resolution
-
Consolidated Table of CRU Evapotranspiration. The ET_MNTHY tabular data layer is comprised of 92717 derivative raster evapotranspiration features derived based on 0.16667_ data originally from CRU. The layer provides nominal analytical/mapping at 1:70 000 000. Acronyms and Abbreviations: CRU - Climatic Research Unit - School of Environmental Sciences, University of East Anglia - Norwich.
-

As part of the the World Bank's review of its rural development strategy, the Bank sought the assistance of the Food and Agriculture Organization of the United Nations (FAO) in evaluating how farming systems might change and adapt over the next thirty years. Amongst other objectives, the World Bank asked FAO to provide guidance on priorities for investment in food security, poverty reduction, and economic growth, and in particular to identify promising approaches and technologies that will contribute to these goals. The results of the study are summarized in a set of seven documents, comprising six regional reports and the global overview contained in this volume. This document, which synthesises the results of the six regional analyses as well as discussing global trends, cross-cutting issues and possible implementation modalities, presents an overview of the complete study. This document is supplemented by two case study reports of development issues of importance to farming systems globally.
-

Mean annual wind velocity (meters/sec) across Africa. Mean annual wind velocity was obtained from UNEP/DEIA/GRID-Geneva.
-
Average annual rainfall in Djibouti, Eritrea, Ethiopia, Kenya, Somalia, Sudan and Uganda.
-
The layer provides the agro-climatic stations located on the Asian coastal areas affected by the Tsunami.
-

The Food and Agriculture Organization of the United Nations (FAO) with the collaboration of the International Institute for Applied Systems Analysis (IIASA), has developed a system that enables rational land-use planning on the basis of an inventory of land resources and evaluation of biophysical limitations and potentials. This is referred to as the Agro-ecological Zones (AEZ) methodology.
-

The Climate Change ATLAS (CSIC) provides climate change information for essential climate variables generated from CMIP and CORDEX international initiatives. The data cubes for CMIP5 precipitation projectons provide gridded projections with a 2 deg spatial resolution as 1) relative differences (%) for three reference future periods (2021-2040, 2041-2060, 2080-2100) for RCP 2.6 an 8.5 scenarios with respect to the baseline reference period 1981-2010, and 2) relative differences (%) corresponding to three Global Warming Levels (1.5, 2 and 3 degC, obtained from the RCP8.5 scenario), with respect to preindustrial values (as characterized by the 1850-1900 period). Geospatial data from the ensemble of CMIP5 models represents the ensemble mean. The list of models used is available at https://github.com/SantanderMetGroup/ATLAS/tree/master/AtlasHub-inventory
-
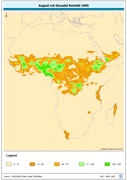
April 1st-Decadal Rainfall 1996. The APR1_95 grid data layer is comprised of 1152x1152 derivative raster precipitation features derived based on 8 kilometers data originally from EDC. 2nd and 3rd Decadal Rainfall from January to December is also available for download. Acronyms and Abbreviations: EDC - USGS EROS (Earth Resources Observation Systems) Data Center
-
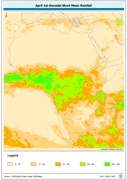
April 1st-Decadal Short Mean Rainfall. The APR1_SM grid data layer is comprised of 1152x1152 derivative raster precipitation features derived based on 8 kilometers data originally from EDC. 2nd and 3rd Decadal Rainfall from January to December is also available for download. Acronyms and Abbreviations: EDC - USGS EROS (Earth Resources Observation Systems) Data Center
-
Cimanuk watershed (West Java) isohyetal map (mm); Driest month (P - of the driest month); Rainest month; Rainfall sequence types-