 FAO Map Catalog
boundaries
Type of resources
Available actions
Topics
Keywords
Contact for the resource
Provided by
Years
Formats
Representation types
Update frequencies
status
Scale
Resolution
-
This dataset represents the second-level administrative unit 'Cercles' of Mali. Mali is divided into eight regions and one capital district (Bamako); those are subdivided into 55 cercles. The dataset was uploaded by Institut Géographique du Mali, National Geospatial Information Authority in September 2021 to Second Administrative Level Boundaries (SALB) Program of United Nations. The reference scale for this Geospatial data is equivalent to 1:1,000,000 scale, or larger scale. Data was downloaded from UN-SALB site in May 2022, feature topology/geometry was corrected, international borders validated against the United Nations official borders (United Nations Geospatial Information Section - UN-Map 2018). The dataset is part of FAO's Hand-in-Hand (HiH) second administrative level boundaries 2022 dataset series, published on the HiH Geospatial Platform for thematic mapping, integration of geospatially enabled statistics, zonal statistics extraction, and used for HiH initiative geospatial analysis (GIS-MCDA, suitability/location analysis, agricultural typologies).
-
This dataset represents the second-level administrative unit 'Arrondissements' of Haiti. As of 2015, the 10 departments of Haiti were divided into 41 arrondissements. The dataset was uploaded by the Centre National de l'information Geo-Spatiale, Haiti in October 2019 for Second Administrative Level Boundaries (SALB) Program of United Nations. The reference scale for this Geospatial data is equivalent to 1:1,000,000 scale, or larger scale. Data was downloaded from UN-SALB site in May 2022, feature topology/geometry was corrected, international borders validated against the United Nations official borders (United Nations Geospatial Information Section - UN-Map 2018). The dataset is part of FAO's Hand-in-Hand (HiH) second administrative level boundaries 2022 dataset series, published on the HiH Geospatial Platform for thematic mapping, integration of geospatially enabled statistics, zonal statistics extraction, and used for HiH initiative geospatial analysis (GIS-MCDA, suitability/location analysis, agricultural typologies).
-
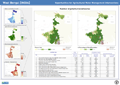
This map shows where AWM can be the entry point for improving livelihoods and where to prioritize investments in AWM to have the maximum impact on rural livelihoods. High potential areas are those showing the highest potential for AWM investment. These areas are identified on the basis of three guiding principles: 1) where water is available 2) where the target beneficiaries are mostly located; and 3) where agricultural water management is key for livelihoods.
-
This map, (Source: L'Atlas du Monde Diplomatique 2010. Armand Colin. From data of the World Bank), compiled to support the analysis of SOLAW report concerning land tenure and water rights (FAO -NRL, SOLAW 2010 Report 5A - Hotspots of land tenure and water rights) shows differences of productivity in agricultural work. Averages at country levels can be misleading. Differences in net productivity of agricultural labor may go beyond 1 to 500, before subsidies and such differences are also found in many countries. This is the case of Brazil, whose average productivity is intermediate between those of developed countries and developing countries, but which actually shows on its own territory very dissimilar levels of agriculture productivity.
-

The participatory mapping process (the steps before) allowed for the gathering of national expertsâ perspectives on how and where AWM can contribute to the improvement of the lives of small-scale agricultural producers. The how, where and who are identified based on the following factors: Population density: measured as rural population in a given livelihood zone Water constraints: Expressed as percentage of rural population perceiving water (management) as the main limiting factor for agricultural production. Water availability: Expressed as the share of rural population whose water demand would be fulfilled given the current water availability in a specific area. Based on these criteria the map on the potential population that can benefit from the AWM investment options were developed. The population is presented as an absolute number (density of beneficiaries) and as a percentage of the total rural population, in order to identify within-country variations and therefore the need for context and site-specific investments and interventions.
-

Physical conservation for drip irrigation systems has been assessed on the basis of time to reach the markets, type of soil and distance to surface water. - Access to markets: Average time to reach the closest market ( less than 4 hours is considered as highly suitable) - Access to surface water: suitable zones are the ones within a distance of 1km or less -Presence of shallow groundwater: associated to the presence of gleysols
-
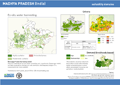
This map shows areas suitable for the Agricultural Water Management interventions as identified by the project. The assessment is based primarily on each intervention's bio-physical requirements (such as: climate, proximity to water resources, terrain), but it also includes a qualitative rating based on socio-economic settings (namely distance to markets).
-
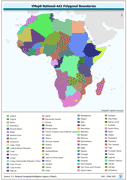
Ad1-Seamless and topologically robust derivative of all polygonal VMap0 - Ed5 coastline and national/sovereign boundary data layers cross-checked against related linear vectors. The AD1_PY shapefile data layer is comprised of 1122 derivative vector framework library features derived based on 1:1 000 000 data originally from VMap0, 5th Edition. The layer provides nominal analytical/mapping at 1:1 000 000. Data processing complete globally, this is an African subset. Acronyms and Abbreviations: VMap0 - Vector Map for Level 0.
-

This layer represents the political administration level 2 boundaries (level of Commune, and Constituency) in Angola and Namibia, that share geographical overlapping with the Okavango Basin. Source: Generated under the GIS EPSMO program. This dataset is part of the GIS Database for the Environment Protection and Sustainable Management of the Okavango River Basin project (EPSMO). Detailed information on the GIS Database can be found in the “GIS Database for the EPSMO Project†document produced by Luis Veríssimo (FAO consultant) in July 2009, and here available for download.