 FAO Map Catalog
FAO-AGAL
Type of resources
Available actions
Topics
Keywords
Contact for the resource
Provided by
Formats
Representation types
Update frequencies
status
Scale
-
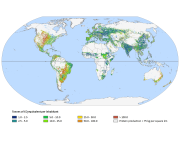
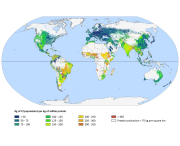
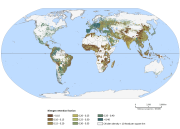
This dataset represents the total GHG emissions from livestock supply chains per capita. Source: GLEAM. GIS data for human population: Dobson et al., Land Scan: a global population database for estimating populations at risk. 2000 A raster layer containing the surface area of each cell within the thematic map is also available for download as ancillary dataset. Source: GLEAM
-
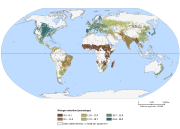
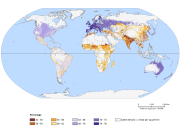
This data set represents the percentage of total nitrogen present in the feed ration which is retained in the products (milk in this case). A raster layer containing the surface area of each cell within the thematic map is also available for download as ancillary dataset. Source: GLEAM
-
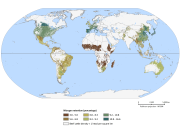
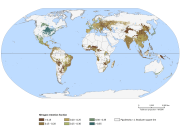
This data set represents the percentage of total nitrogen present in the feed ration which is retained in the products (meat in this case). A raster layer containing the surface area of each cell within the thematic map is also available for download as ancillary dataset. Source: GLEAM
-
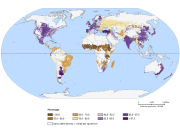
This data set represents the carbon dioxide emission intensity values per pixel with 5 minutes arc resolution. A raster layer containing the surface area of each cell within the thematic map is also available for download as ancillary dataset. Source: GLEAM
-
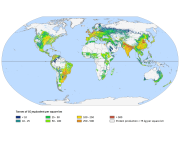
This data set represents the total GHG emissions from livestock supply chains per kilogram of edible protein from meat, milk and eggs. A raster layer containing the surface area of each cell within the thematic map is also available for download as ancillary dataset. Source: GLEAM
-
This data set represents the average feed digestibility (or net energy content) expressed as percentage of the total ration for dairy and non-dairy cattle herds across different production systems. A raster layer containing the surface area of each cell within the thematic map is also available for download as ancillary dataset. Source: GLEAM
-
This data set represents the percentage of total nitrogen present in the feed ration which is retained in the products (meat in this case). A raster layer containing the surface area of each cell within the thematic map is also available for download as ancillary dataset. Source: GLEAM
-
This data set represents the share of milk proteins from dairy herds in the total protein amount from livestock sources. Each pixel represents the average across different production systems. A raster layer containing the surface area of each cell within the thematic map is also available for download as ancillary dataset. Source: GLEAM
-
This data set represents the percentage of total nitrogen present in the feed ration which is retained in the products (meat and eggs in this case). A raster layer containing the surface area of each cell within the thematic map is also available for download as ancillary dataset. Source: GLEAM
-

High-resolution, multi-purpose land cover products are available for a few countries only worldwide. The Africover Eastern Africa module (AFRICOVER) of the Global Land Cover Network (GLCN) initiative (www.glcn.org) produced detailed land cover maps for ten countries in Eastern Africa. The land cover database was created based on the visual on-screen interpretation of Landsat imagery in combination with in-situ validation data and expert knowledge. The land cover database includes the following ten countries: Burundi, Democratic Republic of Congo, Egypt, Eritrea, Kenya, Rwanda, Somalia, Sudan, United Republic of Tanzania and Uganda (FAO 1998). The Landsat images used for mapping were acquired between 1995 and 2001 and have been interpreted at a scale of 1:200,000 or 1:100,000 respectively for large or small countries. The legend used in AFRICOVER products is based on the Land Cover Classification System (LCCS). The full-resolution versions of the 10 datasets were used as input to derive circa 1-km grids of crop percentages. Land cover classes were first analysed at the level of polygon by using LCCS definitions, thereby deriving the minimum, maximum and mean crop percentage for each polygon. A ‘best estimate’ of crop percentage, normally but not always corresponding to the mean, was also established. Results were subsequently rasterized to an intermediate 100m-resolution product and finally aggregated to 1km resolution map. All types of crops are considered, including herbaceous, shrub and tree crops. A comparable product has been generated from the 2005 land cover of Senegal (GLCN, 2005)(Cropland extent in Senegal).