 FAO Map Catalog
vegetation
Type of resources
Available actions
Topics
Keywords
Contact for the resource
Provided by
Years
Representation types
Update frequencies
status
Scale
-
Normalized Difference Vegetation Index (NDVI) average (1982-1990) in Djibouti, Eritrea, Ethiopia, Kenya, Somalia, Sudan and Uganda. This index is recorded by satellites. It is a measure of photosynthetically active green biomass, and ranges from -0.1 to 0.65. The higher the index, the more living green biomass (natural vegetation and crops if any) can be found.
-

Include: Carte detaillée des sols Carte detaillée de la végétation
-

Coverage: Nakta (NE-37). Asmera (ND-37). Metu-Tewodros-Ketema (NC-36/ND-36). Addis-Ababa (NC-37). Harer-Aseb (NC-38/ND-38). Mizan Teferi-Moyale (NA 37/NB 36). Awasa (NB-37). Gode (NA-38)
-
Distribution of Ecoregions within the Okavango Basin. Source: World Wild Life Fund (WWF). This dataset is part of the GIS Database for the Environment Protection and Sustainable Management of the Okavango River Basin project (EPSMO). Detailed information on the database can be found in the “GIS Database for the EPSMO Project†document produced by Luis Veríssimo (FAO consultant) in July 2009, and here available for download.
-

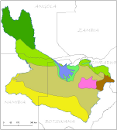
Vegetation classes according to White's (1983) classification within the Okavango Basin. Source: Vegetation Map of Africa, White 1983, UNESCO/AETFAT/UNSO. This dataset is part of the GIS Database for the Environment Protection and Sustainable Management of the Okavango River Basin project (EPSMO). Detailed information on the database can be found in the “GIS Database for the EPSMO Project†document produced by Luis Veríssimo (FAO consultant) in July 2009, and here available for download.
-
This vector layer delineates the phytogeographic units within the Okavango Basin. Source: Several (FAO, WCMC, Phytogeographic Chart of Angola). Irreconcilable adjustments between Namibia and Botswana. This dataset is part of the GIS Database for the Environment Protection and Sustainable Management of the Okavango River Basin project (EPSMO). Detailed information on the database can be found in the “GIS Database for the EPSMO Project†document produced by Luis Veríssimo (FAO consultant) in July 2009, and here available for download.
-
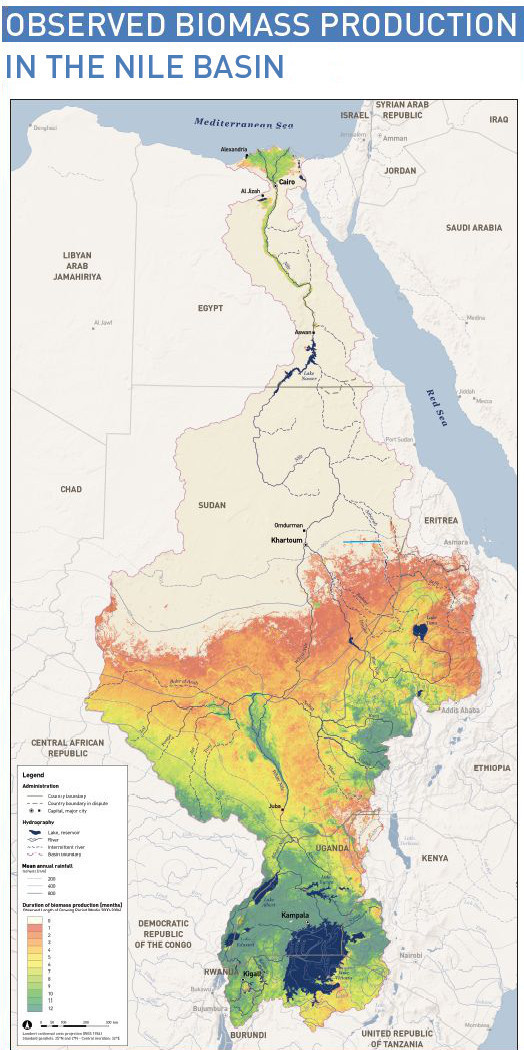
This map shows the spatial distribution of observed biomass production in the Nile Basin. It also relates annual biomass production to the irrigation volumes withdrawn from the Nile and to total annual rainfall. Biomass production is calculated monthly using the Normalized Difference Vegetation Index (NDVI). The base data are obtained from the orbiting MODIS Terra satellite sensor for the period 2000 to 2004. For all Nile countries annual rain volumes and biomass production are calculated and represented by proportional circles, which are drawn to the scale of the map. The green area represents total vegetation growth under rainfall while the blue area is the amount of biomass from stream flow. As can be observed, large parts of Egypt and the Sudan (the Sahara Desert) have no vegetation at all. On the other hand, the Lake Victoria region is covered with vegetation throughout the year, so is the Sudd in southern Sudan. This map clearly indicates where water is the main constraint to vegetation growth. It should be noted, however, that it does not consider the quality of the vegetation.
-
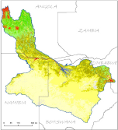
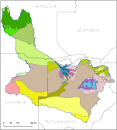
This raster layer represents the land cover classification within the Okavango Basin. Source: Generated under the GIS EPSMO program (Classification based on MODIS Vegetation Continues Fields data from 2000-2005). This dataset is part of the GIS Database for the Environment Protection and Sustainable Management of the Okavango River Basin project (EPSMO). Detailed information on the database can be found in the “GIS Database for the EPSMO Project†document produced by Luis Veríssimo (FAO consultant) in July 2009, and here available for download.