 FAO Map Catalog
crop production
Type of resources
Available actions
Topics
Keywords
Contact for the resource
Provided by
Formats
Representation types
Update frequencies
status
Resolution
-

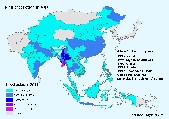
Harvested area for the year 2010 for wheat, cotton and sugarcane under rain-fed, irrigated and total water supply conditions. The Harvested area dataset, at about 5 km resolution, is part of the GAEZ v4 Actual Yields and Production - Area, Yield and Production sub-theme. For additional information, please refer to the GAEZ v4 Model Documentation.
-
This data set has been produced in the framework of the "Climate change predictions in Sub-Saharan Africa: impacts and adaptations (ClimAfrica)" project, Work Package 3 (WP3). WP3 aimed at quantifying the sensitivity of vegetation productivity and water resources to seasonal, inter-annual and decadal variability in weather and climate, using impact models on agriculture and water. The available models in combination with developed datasets of land use and climate from WP2 were used to simulate crop yield and water resources. Simulations using short-term scenarios of future climate change (5-10 years) were used to identify regional differences in the climate sensitivity of crop production etc. Scenarios for the African agricultural/pastoral sectors were also made using longer model runs. Finally, tradeoffs and areas of risk and vulnerability were identified in relation to: - Water-related hazards; - Agricultural and pastoral performance; - Soil degradation. More information on ClimAfrica project is provided in the Supplemental Information section of this metadata.
-

This dataset is one of the outputs of the Global Spatially-Disaggregated Crop Production Statistics Data (MapSPAM) for 2010, which includes physical area, harvest area, production and yield, for 42 crops, disaggregated at the input-levels (e.g., irrigated/rainfed and high/low-input) on a 10 km grid globally. Production values in this dataset are given for each technology aggregated by categories - crops/food/non-food - with no information on individual crops. Unit of measure: Production for each technology: mt This new version of MapSPAM, available to download from the Harvard Dataverse Website, marks the third generation of the SPAM data series, following those of 2000 and 2005. More information on the production systems and selected crops is available in the Global Spatially-Disaggregated Crop Production Statistics Data (MapSPAM) full metadata at https://data.apps.fao.org/map/catalog/srv/eng/catalog.search#/metadata/59f7a5ef-2be4-43ee-9600-a6a9e9ff562a
-
Agro-MAPS consists of selected agricultural land-use statistics (crop production, area harvested and crop yield) aggregated by sub-national administrative districts for selected years. The full Agro-MAPS database currently contains data for 134 countries - 130 countries at admin1 level; 59 countries at admin2 level. These countries represent 92% of the world land surface. Users can interactively query and display Agro-MAPS data as maps, for a given country or region (Africa, Asia, North America, Latin America & the Caribbean, Asia, Near East in Asia, Oceania).
-
This dataset is one of the key indicators of the Global Spatially-Disaggregated Crop Production Statistics Data (MapSPAM) for 2010, which includes physical area, harvest area and yield, for 42 crops — disaggregated at the input-levels (e.g., irrigated/rainfed and high/low-input) on a 10 km grid globally. This new version of MapSPAM, available to download from the Harvard Dataverse Website, marks the third generation of the SPAM data series, following those of 2000 and 2005. Unit of measure Production for each crop and technology: mt More information on the production systems and selected crops is available in the Global Spatially-Disaggregated Crop Production Statistics Data (MapSPAM) full metadata at https://data.apps.fao.org/map/catalog/srv/eng/catalog.search#/metadata/59f7a5ef-2be4-43ee-9600-a6a9e9ff562a
-
This dataset is one of the outputs of the Global Spatially-Disaggregated Crop Production Statistics Data (MapSPAM) for 2010, which includes physical area, harvest area, production and yield, for 42 crops, disaggregated at the input-levels (e.g., irrigated/rainfed and high/low-input) on a 10 km grid globally. Crop production values in this dataset are given per ha for each technology aggregated by categories - crops/food/non-food - with no information on individual crops. Unit of measure: Production per ha for each technology: mt/ha This new version of MapSPAM, available to download from the Harvard Dataverse Website, marks the third generation of the SPAM data series, following those of 2000 and 2005. More information on the production systems and selected crops is available in the Global Spatially-Disaggregated Crop Production Statistics Data (MapSPAM) full metadata at https://data.apps.fao.org/map/catalog/srv/eng/catalog.search#/metadata/59f7a5ef-2be4-43ee-9600-a6a9e9ff562a
-

Production for the year 2010 for wheat, cotton and sugarcane under rain-fed, irrigated and total water supply conditions. The Crop Production dataset, at about 5 km resolution, is part of the GAEZ v4 Actual Yields and Production - Area, Yield and Production sub-theme. For additional information, please refer to the GAEZ v4 Model Documentation.
-

Agricultural production and land statistics are available at national scale from FAOSTAT database, but these statistical data cannot capture the spatial heterogeneity of agricultural production systems at fine resolutions within country boundaries. In this case a “downscaling” method is needed for plausible attribution of aggregate national production statistics to individual spatial units (grid cells) by applying formal methods that account for land characteristics, assess possible production options and can use available evidence from observed or inferred geo-spatial information, including remotely sensed land cover, soil, climate and vegetation distribution, population density and distribution, etc. Theme 5 spatial layers include mapped distributions of harvested area, yield and production at 5 arc-minute resolution for 26 major crops/crop groups, separately in rain-fed and irrigated cropland. Country totals are based on FAO statistics for the years 2009-2011. Also included are estimates of the spatial distribution of total crop production value and the production values of major crop groups (cereals, root crops, oil crops), all valued at year 2000 international prices, separately for rain-fed and irrigated cropland. This theme is organized into two main sub-themes: (1) Area, Yield and Production, and (2) Aggregate Crop Production Value. GAEZ methodology development, data base compilation, production of results and establishing the Data Portal were accomplished in close technical collaboration and with inputs of the International Institute for Applied Systems Analysis (IIASA). For further details, please refer to the GAEZ v4 Model Documentation.
-
Suitability maps (produced through a combination of soil and climate suitability) for maize, millet and Sorghum, for baseline (1971-2000), 2025 (2010-2039), 2055 (2040-2069), and 2085 (2070-2099). Input Parameters for Climate: Minimum and Maximum Temperature, Precipitation. Input Parameters for Soil: Texture, Depth, Drainage, Slope, pH, Organic content, Ece, EXP Input Sources for Climate: 3 GCMs (MIROC5, CanESM2 and NOAA-GFDL) statistically downscaled by UCT at 0.5°, RCP 8.5. Input Sources for Soil: HWSD. This data set has been produced in the framework of the "Climate change predictions in Sub-Saharan Africa: impacts and adaptations (ClimAfrica)" project, Work Package 3 (WP3). WP3 aimed at quantifying the sensitivity of vegetation productivity and water resources to seasonal, inter-annual and decadal variability in weather and climate, using impact models on agriculture and water. The available models in combination with developed datasets of land use and climate from WP2 were used to simulate crop yield and water resources. Simulations using short-term scenarios of future climate change (5-10 years) were used to identify regional differences in the climate sensitivity of crop production etc. Scenarios for the African agricultural/pastoral sectors were also made using longer model runs. Finally, tradeoffs and areas of risk and vulnerability were identified in relation to: - Water-related hazards; - Agricultural and pastoral performance; - Soil degradation. More information on ClimAfrica project is provided in the Supplemental Information section of this metadata.
-
Length of growing season maps for maize, millet and Sorghum, for baseline (1971-2000), 2025 (2010-2039), 2055 (2040-2069), and 2085 (2070-2099). Input Parameters for Climate: Minimum and Maximum Temperature. Input Sources for Climate: 3 GCMs (MIROC5, CanESM2 and NOAA-GFDL) statistically downscaled by UCT at 0.5°, RCP 8.5. This data set has been produced in the framework of the "Climate change predictions in Sub-Saharan Africa: impacts and adaptations (ClimAfrica)" project, Work Package 3 (WP3). WP3 aimed at quantifying the sensitivity of vegetation productivity and water resources to seasonal, inter-annual and decadal variability in weather and climate, using impact models on agriculture and water. The available models in combination with developed datasets of land use and climate from WP2 were used to simulate crop yield and water resources. Simulations using short-term scenarios of future climate change (5-10 years) were used to identify regional differences in the climate sensitivity of crop production etc. Scenarios for the African agricultural/pastoral sectors were also made using longer model runs. Finally, tradeoffs and areas of risk and vulnerability were identified in relation to: - Water-related hazards; - Agricultural and pastoral performance; - Soil degradation. More information on ClimAfrica project is provided in the Supplemental Information section of this metadata.