 FAO Map Catalog
Nile Basin Water Resources Management
Type of resources
Available actions
Topics
Keywords
Contact for the resource
Provided by
Representation types
Update frequencies
status
-
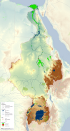
This map shows the results of a distributed water balance model used by FAO to assess the impact of irrigated agriculture on river basin flows. Based on a 5 arc minute cell size (approximately 10 km2 at the Equator), daily rainfall and evapotranspiration data are used to generate outflows at both the country and sub-basin levels. The resulting water balances for each sub-basin are calibrated on mean flows reported by Sutcliffe and Parks (1999). Full details of the model results are given in the FAO Nile Information Products Synthesis Report.
-
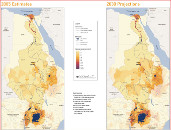
The population prospects in the Nile Basin present two maps of human population distribution in the Nile countries: an estimate for 2005, and a projection for 2030. Landscan 2004 provided the geo-referenced base layer. It was combined with the medium demographic growth variant for 2030, obtained for each Nile country from UNDESA. The maps show the high population densities in the Lake Victoria region, the Nile delta and valley, the Ethiopian highlands, and around Khartoum. Outside the Nile valley, large areas of the Democratic Republic of the Congo, Eritrea, Kenya, the Sudan and the United Republic of Tanzania are sparsely populated. It also shown that the settlement pattern in the lower riparians follows the Nile, while in the upper riparians it tends to follow – broadly – rainfall distribution. Data Sources in details: - United Nations Population Division (UNDESA), 2030 medium variant; - US Bureau of Census, 2005; - LandScan 2004 Distributed Population layer; - AFRICOVER urban areas; - ESRI Gazetteer; - Urban polygons digitized by the project for DR Congo, Egypt and Ethiopia.
-
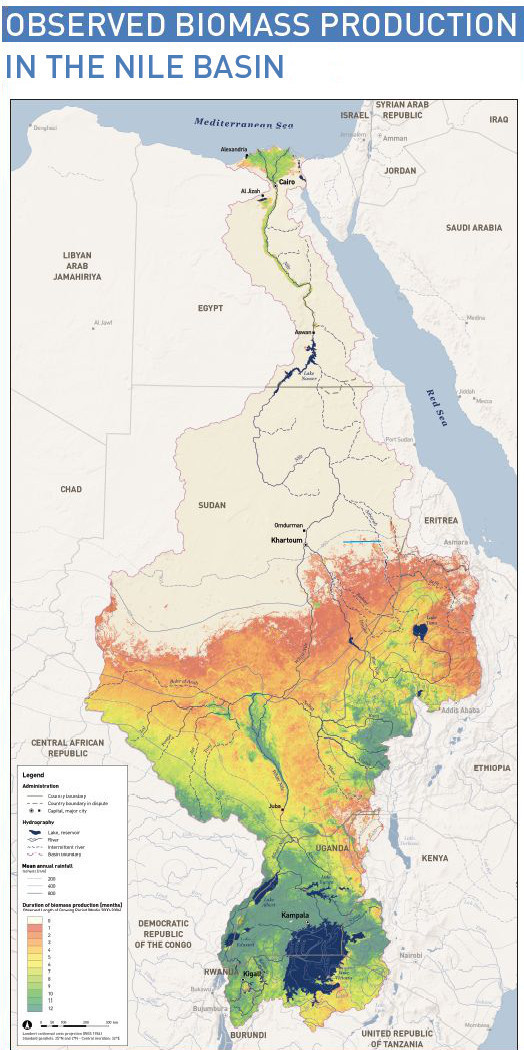
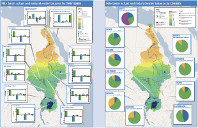
This map shows the spatial distribution of observed biomass production in the Nile Basin. It also relates annual biomass production to the irrigation volumes withdrawn from the Nile and to total annual rainfall. Biomass production is calculated monthly using the Normalized Difference Vegetation Index (NDVI). The base data are obtained from the orbiting MODIS Terra satellite sensor for the period 2000 to 2004. For all Nile countries annual rain volumes and biomass production are calculated and represented by proportional circles, which are drawn to the scale of the map. The green area represents total vegetation growth under rainfall while the blue area is the amount of biomass from stream flow. As can be observed, large parts of Egypt and the Sudan (the Sahara Desert) have no vegetation at all. On the other hand, the Lake Victoria region is covered with vegetation throughout the year, so is the Sudd in southern Sudan. This map clearly indicates where water is the main constraint to vegetation growth. It should be noted, however, that it does not consider the quality of the vegetation.
-
This map shows the Geographic Information System (GIS) ancillary information used to prepare thematic posters for the FAO-Nile Basin project. They are: -administrative units; -basin boundary; -boundary above water bodies; -country boundaries; canals&tunnels; -cities; -irrigated areas; -protected areas; -rivers; urban areas; -water bodies; -SRTM. Sources and information for each layer can be found in the "FAO Nile Information Products Synthesis Report" here available in the Distribution section of this metadata form.