 FAO Map Catalog
Malawi
Type of resources
Available actions
Topics
Keywords
Contact for the resource
Provided by
Years
Formats
Representation types
Update frequencies
status
Resolution
-

Accessibility to major cities dataset is modeled as raster-based travel time/cost analysis, computed for the largest cities (>50k habitants) in the country. This 500m resolution raster dataset is part of FAO’s Hand-in-Hand Initiative, Geographical Information Systems - Multicriteria Decision Analysis (GIS-MCDA) aimed at the identification of value chain infrastructure sites (or optimal location).
-

The raster dataset consists of a 500m score grid for the sweet potato storage location, produced under the scope of FAO’s Hand-in-Hand Initiative, Geographical Information Systems - Multicriteria Decision Analysis for value chain infrastructure location. The location score is achieved by processing sub-model outputs that characterize logistical factors for selected crop warehouse locations: • Supply: Crop. • Demand: Human population density, Major cities population (national and bordering countries). • Infrastructure/accessibility: main transportation infrastructure. It consists of an arithmetic weighted sum of normalized grids (0 to 100): ("Crop Production" * 0.4) + ("Human Population Density" * 0.2) + (“Major Cities Accessibility” * 0.1) + (”Regional Cities Accessibility” *0.2 ) + (”Asset Wealth” *0.1 )
-

Accessibility to regional cities dataset is modeled as raster-based travel time/cost analysis, computed for the largest cities surrounding the country. The following cities are included: City - Population Kasama - 520 459 Chipata - 305 396 Tete - 615 231 Mbeya - 445 544 This 500m resolution raster dataset is part of FAO’s Hand-in-Hand Initiative, Geographical Information Systems - Multicriteria Decision Analysis (GIS-MCDA) aimed at the identification of value chain infrastructure sites (or optimal location).
-

The raster dataset consists of a 500m score grid for the sugar cane storage location, produced under the scope of FAO’s Hand-in-Hand Initiative, Geographical Information Systems - Multicriteria Decision Analysis for value chain infrastructure location. The location score is achieved by processing sub-model outputs that characterize logistical factors for selected crop warehouse locations: • Supply: Crop. • Demand: Human population density, Major cities population (national and bordering countries). • Infrastructure/accessibility: main transportation infrastructure. It consists of an arithmetic weighted sum of normalized grids (0 to 100): ("Crop Production" * 0.4) + ("Human Population Density" * 0.2) + (“Major Cities Accessibility” * 0.1) + (”Regional Cities Accessibility” *0.2 ) + (”Asset Wealth” *0.1 )
-

The raster dataset represents top location score areas suitable for sugar cane storage, filtered by exclusive criteria: access to finance, distance to major roads, and access to IT (mobile broadband connection). Access to finance and roads are defined using a linear distance threshold: • Banks - approx. 10km buffer radius. • Major roads - approx. 2km buffer radius. Access to IT is characterized by applying the mobile broadband coverage map. The location score is achieved by processing sub-model outputs characterizing logistical factors for crop warehouse siting: Supply, demand, Infrastructure/accessibility. The location score from 0 to 100 is then obtained through a simple arithmetic weighted sum of the normalized/scaled grids. This 500m resolution raster dataset is part of FAO’s Hand-in-Hand Initiative, Geographical Information Systems - Multicriteria Decision Analysis (GIS-MCDA) aimed at the identification of value chain infrastructure sites (optimal location).
-

The raster dataset represents top location score areas suitable for tropical fruits storage, filtered by exclusive criteria: access to finance, distance to major roads, and access to IT (mobile broadband connection). Access to finance and roads are defined using a linear distance threshold: • Banks - approx. 10km buffer radius. • Major roads - approx. 2km buffer radius. Access to IT and electricity is characterized by applying the mobile broadband coverage map and the Atlas AI Electrification map. The location score is achieved by processing sub-model outputs characterizing logistical factors for crop warehouse siting: Supply, demand, Infrastructure/accessibility. The location score from 0 to 100 is then obtained through a simple arithmetic weighted sum of the normalized/scaled grids. This 500m resolution raster dataset is part of FAO’s Hand-in-Hand Initiative, Geographical Information Systems - Multicriteria Decision Analysis (GIS-MCDA) aimed at the identification of value chain infrastructure sites (optimal location).
-

The raster dataset represents top location score areas suitable for maize storage, filtered by exclusive criteria: access to finance, distance to major roads, and access to IT (mobile broadband connection). Access to finance and roads are defined using a linear distance threshold: • Banks - approx. 10km buffer radius. • Major roads - approx. 2km buffer radius. Access to IT is characterized by applying the mobile broadband coverage map. The location score is achieved by processing sub-model outputs characterizing logistical factors for crop warehouse siting: Supply, demand, Infrastructure/accessibility. The location score from 0 to 100 is then obtained through a simple arithmetic weighted sum of the normalized/scaled grids. This 500m resolution raster dataset is part of FAO’s Hand-in-Hand Initiative, Geographical Information Systems - Multicriteria Decision Analysis (GIS-MCDA) aimed at the identification of value chain infrastructure sites (optimal location).
-

The raster dataset consists of a 500m score grid for the tropical fruits storage location, produced under the scope of FAO’s Hand-in-Hand Initiative, Geographical Information Systems - Multicriteria Decision Analysis for value chain infrastructure location. The location score is achieved by processing sub-model outputs that characterize logistical factors for selected crop warehouse locations: • Supply: Crop. • Demand: Human population density, Major cities population (national and bordering countries). • Infrastructure/accessibility: main transportation infrastructure. It consists of an arithmetic weighted sum of normalized grids (0 to 100): ("Crop Production" * 0.4) + ("Human Population Density" * 0.2) + (“Major Cities Accessibility” * 0.1) + (”Regional Cities Accessibility” *0.2 ) + (”Asset Wealth” *0.1 )
-

The 500 m raster dataset represents selected top location score areas filtered by exclusive criteria: access to finance, distance to major roads, access to IT, and distance to urban areas. The layer was produced under the scope of FAO’s Hand-in-Hand Initiative, Geographical Information Systems - Multicriteria Decision Analysis for value chain infrastructure location. The location score is achieved by processing sub-model outputs characterizing logistical factors dairy processing facilities siting: Supply, demand, Infrastructure/accessibility. The top score is selected/clipped using the exclusive criteria. Access to finance, distance to roads, and urban areas are defined using a linear distance threshold: • Banks - approx. 10km buffer radius. • Major roads - approx. 2km buffer radius. Access to IT and electricity is characterized by applying the mobile broadband coverage map and the Atlas AI Electrification map.
-
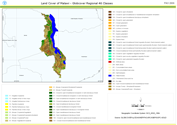
This land cover data set is derived from the original raster based Globcover regional (Africa) archive. It has been post-processed to generate a vector version at national extent with the LCCS regional legend (46 classes). This database can be analyzed in the GLCN software Advanced Database Gateway (ADG), which provides a user-friendly interface and advanced functionalities to breakdown the LCCS classes in their classifiers for further aggregations and analysis. The data set is intended for free public access. The shape file's attributes contain the following fields: -Area (sqm) -ID -Gridcode (Globcover cell value) -LCCCode (unique LCCS code) You can download a zip archive containing: -the shape file (.shp) -the ArcGis layer file with global legend (.lyr) -the ArcView 3 legend file (.avl) -the LCCS legend tables (.xls)