 FAO Map Catalog
MENA - Middle East and North Africa
Type of resources
Available actions
Topics
Keywords
Contact for the resource
Provided by
Formats
Representation types
Update frequencies
status
-

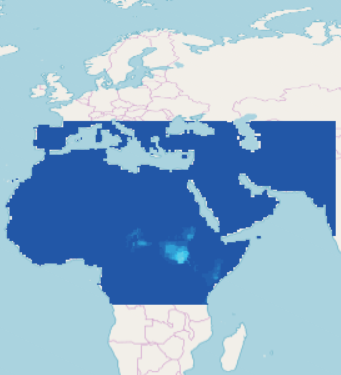
This raster dataset provides a representation of TAS Indicator, Annual Temperature, in the Middle East and North Africa Region, for the reference period 1986-2005. The Regional Climate Model (RCM) ensemble adopts the time periods generally used by the Intergovernmental Panel for Climate Change (IPCC) and other regional climate modelling experiments. It runs climate simulations based on three future time periods that are compared with a historical reference period. Available for 1986-2005 reference period, the 50km pixel resolution raster grids are generated for Moderate and High representative concentration pathways (RCPs), climate change scenarios developed by the IPCC for informing global and regional climate modelling work: RCP4.5 and RCP8.5
-

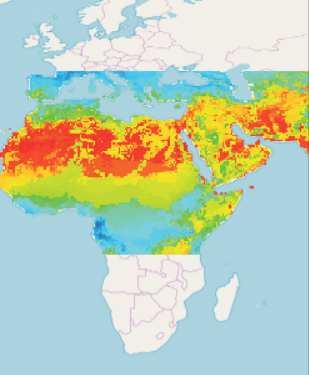
This raster dataset provides a representation of the extreme temperature index Seasonal SU35, Seasonal Hot Days - Seasonal number of days when daily maximum temperature > 35ºC - for the Middle East and North Africa Region from 1951 to 2100. The climate change projections use global climate models/global circulation models (GCMs). These are numerical models that combine physical processes on the land surface and in the ocean, atmosphere and cryosphere to simulate the response of the global climate system to increasing greenhouse-gas concentrations. The 50km pixel resolution raster grids are provided for three of the four representative concentration pathways (RCPs), climate change scenarios developed by IPCC for informing global and regional climate modelling work, namely; low, moderate and high (RCP2.6 /4.5 /8.5) and generated for each of the GCMs: - CNRM-CM5 System Model; - EC-EARTH System Model; - NOAA-GFDL-GFDL-ESM2M System Model. Four seasons are defined as: 1 - December-January-February; 2 - March-April-May; 3 - June-July-August; 4 - September-October-November.
-
This raster dataset provides a representation of the extreme temperature index seasonal SU40 Indicator, Seasonal Very Hot Days - Seasonal number of days when daily maximum temperature > 40ºC - for the Middle East and North Africa Region from 1951 to 2100. The climate change projections use global climate models/global circulation models (GCMs). These are numerical models that combine physical processes on the land surface and in the ocean, atmosphere and cryosphere to simulate the response of the global climate system to increasing greenhouse-gas concentrations. The 50km pixel resolution raster grids are provided for three of the four representative concentration pathways (RCPs), climate change scenarios developed by IPCC for informing global and regional climate modelling work, namely; low, moderate and high (RCP2.6 /4.5 /8.5) and generated for each of the GCMs: - CNRM-CM5 System Model; - EC-EARTH System Model; - NOAA-GFDL-GFDL-ESM2M System Model. Four seasons are defined as: 1 - December-January-February; 2 - March-April-May; 3 - June-July-August; 4 - September-October-November
-
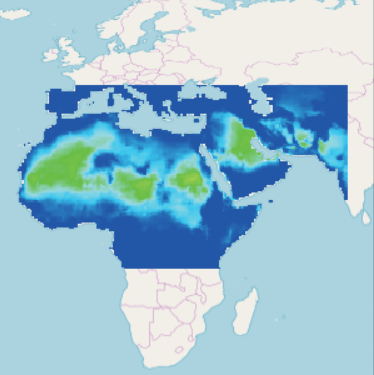
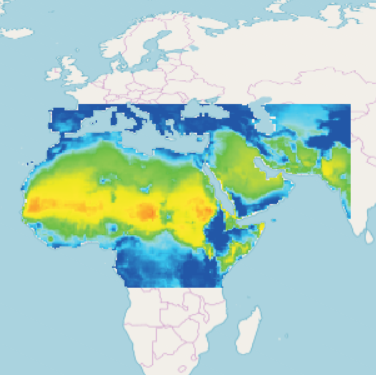
This raster dataset provides a representation of the extreme precipitation index annual CDD – Annual maximum length of dry spell (Maximum number of consecutive days when daily precipitation < 1mm ) - in the Middle East and North Africa Region, 1951-2100 period. The climate change projections use global climate models/global circulation models (GCMs). These are numerical models that combine physical processes on the land surface and in the ocean, atmosphere and cryosphere to simulate the response of the global climate system to increasing greenhouse-gas concentrations. The 50km pixel resolution raster grids are provided for three of the four representative concentration pathways (RCPs) developed by IPCC for informing global and regional climate modelling work namely, low, moderate and high (RCP2.6 /4.5 /8.5) and generated using GCMs: - CNRM-CM5 System Model; - EC-EARTH System Model; - NOAA-GFDL-GFDL-ESM2M System Model.
-
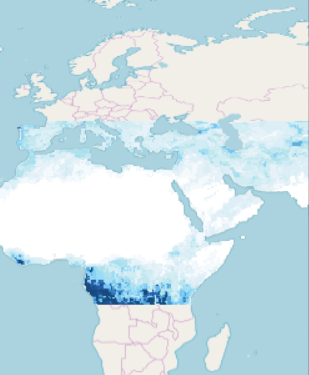
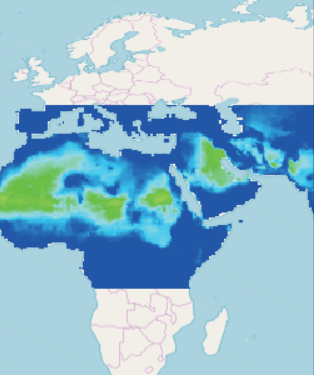
This raster dataset provides a representation of the extreme precipitation index Seasonal CWD – Seasonal maximum length of wet spell (Maximum number of consecutive days when daily precipitation ≥ 1mm ) - in the Middle East and North Africa Region, 1951-2100 period. The climate change projections use global climate models/global circulation models (GCMs). These are numerical models that combine physical processes on the land surface and in the ocean, atmosphere and cryosphere to simulate the response of the global climate system to increasing greenhouse-gas concentrations. The 50km pixel resolution raster grids are provided for three of the four representative concentration pathways (RCPs), climate change scenarios developed by IPCC for informing global and regional climate modelling work, namely; low, moderate and high (RCP2.6/4.5 /8.5) and generated for each of the GCMs: - CNRM-CM5 System Model; - EC-EARTH System Model; - NOAA-GFDL-GFDL-ESM2M System Model. Four seasons are defined as: 1 - December-January-February; 2 - March-April-May; 3 - June-July-August; 4 - September-October-November.
-

This raster dataset provides a representation of the annual TR Indicator, Annual Tropical Nights - Number of days when daily minimum temperature > 20ºC - for the Middle East and North Africa Region from 1951 to 2100. The climate change projections use global climate models/global circulation models (GCMs). These are numerical models that combine physical processes on the land surface and in the ocean, atmosphere and cryosphere to simulate the response of the global climate system to increasing greenhouse-gas concentrations. The 50km pixel resolution raster grids are provided for three of the four representative concentration pathways (RCPs) developed by IPCC for informing global and regional climate modelling work namely, low, moderate and high (RCP2.6 /4.5 /8.5) and generated using GCMs: - CNRM-CM5 System Model; - EC-EARTH System Model; - NOAA-GFDL-GFDL-ESM2M System Model.
-
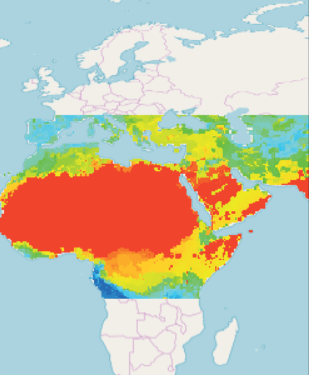
This raster dataset provides a representation of the extreme temperature index SU40, Annual Very Hot Days - Annual number of days when daily maximum temperature > 40ºC - for the Middle East and North Africa Region. The Regional Climate Model (RCM) ensemble adopts the time periods generally used by the Intergovernmental Panel for Climate Change (IPCC) and other regional climate modelling experiments. It runs climate simulations based on three future time periods that are compared with a historical reference period. Available for 1986-2005 reference period, the 50km pixel resolution raster grids are generated for Moderate and High representative concentration pathways (RCPs), climate change scenarios developed by the IPCC for informing global and regional climate modelling work: RCP4.5 and RCP8.5.
-
This raster dataset provides a representation of the extreme temperature index Annual SU40, Annual Very Hot Days - Annual number of days when daily maximum temperature > 25ºC - for the Middle East and North Africa Region from 1951 to 2100. The climate change projections use global climate models/global circulation models (GCMs). These are numerical models that combine physical processes on the land surface and in the ocean, atmosphere and cryosphere to simulate the response of the global climate system to increasing greenhouse-gas concentrations. The 50km pixel resolution raster grids are provided for three of the four representative concentration pathways (RCPs) developed by IPCC for informing global and regional climate modelling work namely, low, moderate and high (RCP2.6 /4.5 /8.5) and generated using GCMs: - CNRM-CM5 System Model; - EC-EARTH System Model; - NOAA-GFDL-GFDL-ESM2M System Model.
-
This raster dataset provides a representation of the extreme temperature index Annual SU35 - Annual Hot Days (number of days when daily maximum temperature > 35ºC) in the Middle East and North Africa Region, for the reference period 1986-2005. The Regional Climate Model (RCM) ensemble adopts the time periods generally used by the Intergovernmental Panel for Climate Change (IPCC) and other regional climate modelling experiments. It runs climate simulations based on three future time periods that are compared with a historical reference period. Available for 1986-2005 reference period, the 50km pixel resolution raster grids are generated for Moderate and High representative concentration pathways (RCPs), climate change scenarios developed by the IPCC for informing global and regional climate modelling work: RCP4.5 and RCP8.5.
-
This raster dataset provides a representation of the extreme precipitation index seasonal CDD – Seasonal maximum length of dry spell (Maximum number of consecutive days when daily precipitation < 1mm ) - in the Middle East and North Africa Region, 1951-2100 period. The climate change projections use global climate models/global circulation models (GCMs). These are numerical models that combine physical processes on the land surface and in the ocean, atmosphere and cryosphere to simulate the response of the global climate system to increasing greenhouse-gas concentrations. The 50km pixel resolution raster grids are provided for three of the four representative concentration pathways (RCPs), climate change scenarios developed by IPCC for informing global and regional climate modelling work, namely; low, moderate and high (RCP2.6 /4.5 /8.5) and generated for each of the GCMs: - CNRM-CM5 System Model; - EC-EARTH System Model; - NOAA-GFDL-GFDL-ESM2M System Model. Four seasons are defined as: 1 - December-January-February; 2 - March-April-May; 3 - June-July-August; 4 - September-October-November.