 FAO Map Catalog
HiH_Precipitation
Type of resources
Available actions
Topics
Keywords
Contact for the resource
Provided by
Years
Formats
Representation types
Update frequencies
status
Scale
Resolution
-

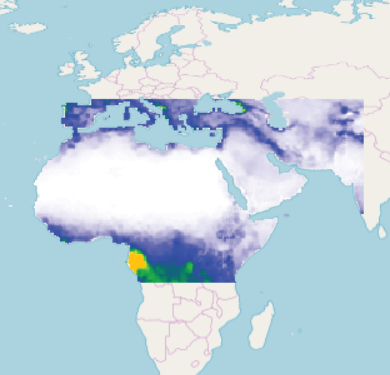
Forecasts of Monthly Precipitation Anomalies. More info on the model in the BAMS article describing the project (Kirtman et al. 2014) at https://journals.ametsoc.org/view/journals/bams/95/4/bams-d-12-00050.1.xml Source: North American Multi-Model Ensemble Approximately 111km (1°) unit: "mm" dataType: "Float32" noDataValue: -9999
-
This raster dataset provides a representation of the extreme precipitation index Change in Annual CDD – Change in annual maximum length of dry spell (Maximum number of consecutive days when daily precipitation < 1mm ) - in the Middle East and North Africa Region.. The Regional Climate Model (RCM) ensemble adopts the time periods generally used by the Intergovernmental Panel for Climate Change (IPCC) and other regional climate modelling experiments. It runs climate simulations based on three future time periods that are compared with a historical reference period. Available at 50km pixel resolution, for future time periods; near, mid and end-century, the raster grids are generated for moderate and high representative concentration pathways (RCPs), climate change scenarios developed by the IPCC for informing global and regional climate modelling work: - RCP4.5 (Moderate); - RCP8.5 (High); Time periods: - Near-Century (2016-2035); - Mid-Century (2046-2065); - End-Century (2081-2100).
-
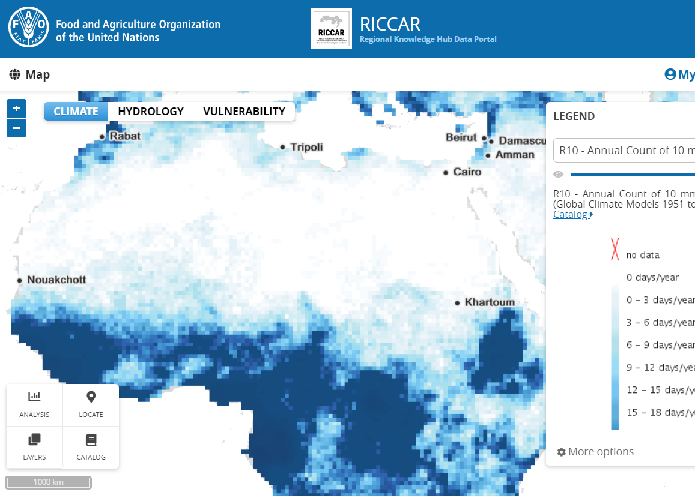
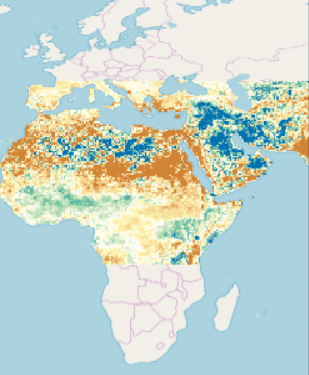
RICCAR, MENA Region - R10 - Annual Count of 10 mm precipitation days (GCM, 1951 to 2100) This raster dataset provides a representation of the heavy precipitation index Annual R10 - Annual count of 10mm precipitation days - number of days when daily precipitation ≥ 10mm - for the Middle East and North Africa Region, 1951-2100 period. The climate change projections use global climate models/global circulation models (GCMs). These are numerical models that combine physical processes on the land surface and in the ocean, atmosphere and cryosphere to simulate the response of the global climate system to increasing greenhouse-gas concentrations. The 50km pixel resolution raster grids are provided for three of the four representative concentration pathways (RCPs), climate change scenarios developed by IPCC for informing global and regional climate modelling work, namely; low, moderate and high (RCP2.6 /4.5 /8.5) and generated for each of the GCMs: - CNRM-CM5 System Model; - EC-EARTH System Model; - NOAA-GFDL-GFDL-ESM2M System Model.
-
This raster dataset provides a representation of the extreme precipitation index annual CDD – Annual maximum length of dry spell (Maximum number of consecutive days when daily precipitation < 1mm ) - in the Middle East and North Africa Region, 1951-2100 period. The climate change projections use global climate models/global circulation models (GCMs). These are numerical models that combine physical processes on the land surface and in the ocean, atmosphere and cryosphere to simulate the response of the global climate system to increasing greenhouse-gas concentrations. The 50km pixel resolution raster grids are provided for three of the four representative concentration pathways (RCPs) developed by IPCC for informing global and regional climate modelling work namely, low, moderate and high (RCP2.6 /4.5 /8.5) and generated using GCMs: - CNRM-CM5 System Model; - EC-EARTH System Model; - NOAA-GFDL-GFDL-ESM2M System Model.
-
This raster dataset provides a representation of the extreme precipitation index Annual CWD – Annual maximum length of wet spell (Maximum number of consecutive days when daily precipitation ≥ 1mm ) - in the Middle East and North Africa Region, 1951-2100 period. The climate change projections use global climate models/global circulation models (GCMs). These are numerical models that combine physical processes on the land surface and in the ocean, atmosphere and cryosphere to simulate the response of the global climate system to increasing greenhouse-gas concentrations. The grids are provided for three of the four representative concentration pathways (RCPs) developed by IPCC for informing global and regional climate modelling work namely, low, moderate and high (RCP2.6 /4.5 /8.5) and generated using GCMs: - CNRM-CM5 System Model; - EC-EARTH System Model; - NOAA-GFDL-GFDL-ESM2M System Model.
-
RICCAR, MENA Region - R20 - Change in Annual Count of 20 mm precipitation days (RCM Ensemble for near-,mid-,end-century) This raster dataset provides a representation of the change in heavy precipitation days index Annual R20 - Annual Count of 20mm precipitation days (number of days when daily precipitation ≥ 20mm) in the Middle East and North Africa Region. The Regional Climate Model (RCM) ensemble adopts the time periods generally used by the Intergovernmental Panel for Climate Change (IPCC) and other regional climate modelling experiments. It runs climate simulations based on three future time periods that are compared with a historical reference period. Available at 50km pixel resolution, for future time periods; Near, Mid and End-century, the raster grids are generated for moderate and high representative concentration pathways (RCPs), climate change scenarios developed by the IPCC for informing global and regional climate modelling work (RCP4.5 and RCP8.5). The adopted time periods are: - Near-Century (2016-2035); - Mid-Century (2046-2065); - End-Century (2081-2100).
-

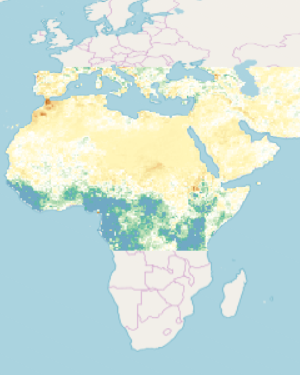
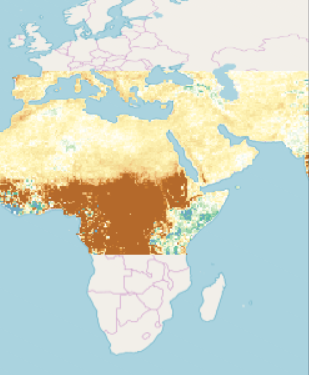
Climate Hazards Group InfraRed Precipitation with Station data (CHIRPS) is a 30+ year quasi-global rainfall dataset. CHIRPS incorporates 0.05° resolution satellite imagery with in-situ station data to create gridded rainfall time series for trend analysis and seasonal drought monitoring. Precipitation anomalies expressed in mm which can be converted into volume for a specific area (1mm=1l/m² or 1mm=10m³/ha). The term "anomaly" means a departure from a reference value or long-term average. For the precipitation anomaly animation, the reference value is the average precipitation over the period 1970-1999. A positive anomaly value indicates that the observed precipitation was greater than the long-term average , while a negative anomaly indicates that the observed precipitation was less than the long-term average. Approximately 5km (0.05°) unit: "mm" dataType: "Float32" noDataValue: -9999
-
Climate Hazards Group InfraRed Precipitation with Station data (CHIRPS) is a 30+ year quasi-global rainfall dataset. CHIRPS incorporates 0.05° resolution satellite imagery with in-situ station data to create gridded rainfall time series for trend analysis and seasonal drought monitoring. Approximately 5km (0.05°) unit: "mm" dataType: "Float32" noDataValue: -9999
-
This raster dataset provides a representation of the change in the extreme precipitation index Annual CWD - Annual Maximum Length of wet Spell (Maximum number of consecutive days when daily precipitation ≥ 1mm ) - in the Middle East and North Africa Region. The Regional Climate Model (RCM) ensemble adopts the time periods generally used by the Intergovernmental Panel for Climate Change (IPCC) and other regional climate modelling experiments. It runs climate simulations based on three future time periods that are compared with a historical reference period. Available at 50km pixel resolution, for future time periods; near, mid and end-century, the raster grids are generated for moderate and high representative concentration pathways (RCPs), climate change scenarios developed by the IPCC for informing global and regional climate modelling work: - RCP4.5 (Moderate); - RCP8.5 (High); Time periods: - Near-Century (2016-2035); - Mid-Century (2046-2065); - End-Century (2081-2100).
-
RICCAR, MENA Region - PR - Seasonal Precipitation (RCM Ensemble for reference period) This raster dataset provides a representation of the Seasonal Precipitation (mm/month) in the Middle East and North Africa Region, for the reference period 1986-2005. The Regional Climate Model (RCM) ensemble adopts the time periods generally used by the Intergovernmental Panel for Climate Change (IPCC) and other regional climate modelling experiments. It runs climate simulations based on three future time periods that are compared with a historical reference period. The 50km pixel spatial resolution seasonal raster grids are available for Moderate and High representative concentration pathways (RCPs) RCP4.5/RCP8.5, climate change scenarios developed by IPCC for informing global and regional climate modelling work. Two seasons are defined as October-March and April-September.