 FAO Map Catalog
Agromet
Type of resources
Available actions
Topics
Keywords
Contact for the resource
Provided by
Representation types
Update frequencies
status
-
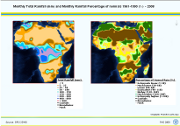
This map is part of a series of global climate images produced by the Agrometeorology Group and based on data for mean monthly values of temperature, precipitation and cloudiness prepared in 1991 by R. Leemans and W. Cramer and published by the International Institute for Applied Systems Analysis (IIASA). For each of the weather stations used data have been assembled over a long time period - usually between 1961 and 1990 - and then averaged.
-
This map is part of a series of global climate images produced by the Agrometeorology Group and based on data for mean monthly values of temperature, precipitation and cloudiness prepared in 1991 by R. Leemans and W. Cramer and published by the International Institute for Applied Systems Analysis (IIASA). For each of the weather stations used data have been assembled over a long time period - usually between 1961 and 1990 - and then averaged. Annual totals for rainfall were derived from the monthly values.
-
Potential biomass is the amount of plant biomass that can be accumulated in one year under the assumption of ideal conditions prevailing for photosynthesis, i.e. absorption of solar energy by plants and storage of the energy as plant material. This map uses one of the earliest methods, developed by H. Lieth and published in 1972. Although this approach is now largely superseded by more complex approaches involving solar energy conversion efficiencies, Lieth's method is interesting in that it clearly shows whether temperature - cold or warm - or water is the main limiting factor. (The unit of measurement is grams of dry matter per sq. metre per year.)
-

Maps on monthly total rainfall amount (in millimeters) and monthly rainfall percentage of normals 1961-1990 (in percentage) from August 2004 to October 2008 are available here for download for Western Africa. Rainfall data are also available in GeoNetwork for the whole African continent and the following Regions : Northern Africa, Western Africa, Eastern Africa and Southern Africa. An interpolation method (Kriging) is applied to input data. Data input for rainfall maps are provided by Global Precipitation Climatology Centre (GPCC) operated by the Deutscher Wetterdienst (DWD, National Meteorological Service of Germany). GPCC First Guess Product, gauge-based gridded monthly precipitation data sets for the global land surface, at spatial resolutions of 1.0 x 1.0 degrees geographical latitude by longitude are used. The First Guess Product of the monthly precipitation anomaly is based on interpolated precipitation anomalies from about 6,000 stations worldwide. Data sources are synoptic weather observation data (SYNOP) received at DWD via the WMO Global Telecommunication System (GTS) and climatic mean (mainly 1961-1990) monthly precipitation totals at the same stations extracted from GPCC s global normals collection. An automatic-only quality-control (QC) is applied to these data. Since September 2003, GPCC First Guess monthly precipitation analyses are available within 5 days after end of an observation month.
-

The new globally gridded Koeppen climatologies are based on climatological observations (temperature and precipitations) rasterized to grids of 0.5 x 0.5 degrees. They cover 4 different periods and are based on 3 different precipitation datasets. This leads to a total number of 12 rasterized Koeppen climatologies. The 4 different periods are: 1. 1951 - 2000 (all), 2. 1961 - 1990 (norm), 3. 1951 - 1975 (early), 4. 1976 - 2000 (late). Source: Mean annual cycles of temperature are always taken from the Climatic Research Unit (CRU, Mitchell and Jones, 2005). Precipitation is taken from GPCC VASClimO data, based on 9,343 stations that provide at least 90% coverage within 1951-2000 (Beck, Grieser and Rudolf, 2005). All different datasets are converted to the same 0.5 x 0.5 grid, which results from USGS gtopo30. Antarctica and Greenland are left out due to lack of data. For further information on the global climate grids please refer to the FAO Climpag website at http://www.fao.org/nr/climpag/globgrids/KC_classification_en.asp.
-
Maps on monthly total rainfall amount (in millimeters) and monthly rainfall percentage of normals 1961-1990 (in percentage) from August 2004 to October 2008 are available here for download for Northern Africa. Rainfall data are also available in GeoNetwork for the whole African continent and the following Regions : Western Africa, Eastern Africa and Southern Africa. An interpolation method (Kriging) is applied to input data. Data input for rainfall maps are provided by Global Precipitation Climatology Centre (GPCC) operated by the Deutscher Wetterdienst (DWD, National Meteorological Service of Germany). GPCC First Guess Product, gauge-based gridded monthly precipitation data sets for the global land surface, at spatial resolutions of 1.0 x 1.0 degrees geographical latitude by longitude are used. The First Guess Product of the monthly precipitation anomaly is based on interpolated precipitation anomalies from about 6,000 stations worldwide. Data sources are synoptic weather observation data (SYNOP) received at DWD via the WMO Global Telecommunication System (GTS) and climatic mean (mainly 1961-1990) monthly precipitation totals at the same stations extracted from GPCC s global normals collection. An automatic-only quality-control (QC) is applied to these data. Since September 2003, GPCC First Guess monthly precipitation analyses are available within 5 days after end of an observation month.
-
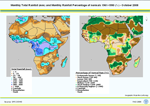
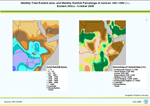
Maps on monthly total rainfall amount (in millimeters) and monthly rainfall percentage of normals 1961-1990 (in percentage) are available here for download from August 2004 to October 2008 for the African continent. Rainfall data are also available in GeoNetwork for the following Regions: Northern Africa, Western Africa, Eastern Africa and Southern Africa. An interpolation method (Kriging) is applied to input data. Data input for rainfall maps are provided by Global Precipitation Climatology Centre (GPCC) operated by the Deutscher Wetterdienst (DWD, National Meteorological Service of Germany). GPCC First Guess Product, gauge-based gridded monthly precipitation data sets for the global land surface, at spatial resolutions of 1.0 x 1.0 degrees geographical latitude by longitude are used. The First Guess Product of the monthly precipitation anomaly is based on interpolated precipitation anomalies from about 6,000 stations worldwide. Data sources are synoptic weather observation data (SYNOP) received at DWD via the WMO Global Telecommunication System (GTS) and climatic mean (mainly 1961-1990) monthly precipitation totals at the same stations extracted from GPCC s global normals collection. An automatic-only quality-control (QC) is applied to these data. Since September 2003, GPCC First Guess monthly precipitation analyses are available within 5 days after end of an observation month.
-
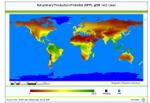
The new versions of the global maps of net primary production (NPP) are based on the most recent gridded data sets of temperature and precipitation. The maps show NPP for the period 1951 to 2000 based on datasets from CRU and GPCP VASClimO. High resolution maps of NPP (5minx5min) as GeoTiffs are available here for download. DIFFERENCES BETWEEN THE 1951-1975 and 1976-2000 PERIOD: Differences in climatic npp between the 1951-1975 and 1976-2000 period appear in some regions of the world. The data shows the latitudinal dependence of these differences. It demonstrates that npp would have increased for most latitudes if temperature were the limiting factor. However, especially between 0 and 20 degrees North the npp decreased because of its precipitation dependency. High resolution images of the differences in npp between 1951-1975 and 1976-2000 for the CRU/VASClimO dataset are also provided here as GeoTIFF for download. CLIMATIC SENSITIVITY OF NPP: The sensitivity of NPP with respect to changes in annual mean temperature dNPP/dT and annual mean precipitation dNPP/dP has been calculated for each location on earth. High resolution GeoTIFF images on sensitivity of net primary production NPP in g(dry matter)/m2/year with respect to changes in annual mean precipitation and annual mean temperature are also available for download in the Distribution Info section of this form. For further information on the NPP grids please refer to the FAO Climpag website at http://www.fao.org/nr/climpag/globgrids/NPP_en.asp.
-

Maps on monthly total rainfall amount (in millimeters) and monthly rainfall percentage of normals 1961-1990 (in percentage) from August 2004 to October 2008 are available here for download for Southern Africa. Rainfall data are also available in GeoNetwork for the whole African continent and the following Regions : Northern Africa, Western Africa, and Eastern Africa. An interpolation method (Kriging) is applied to input data. Data input for rainfall maps are provided by Global Precipitation Climatology Centre (GPCC) operated by the Deutscher Wetterdienst (DWD, National Meteorological Service of Germany). GPCC First Guess Product, gauge-based gridded monthly precipitation data sets for the global land surface, at spatial resolutions of 1.0 x 1.0 degrees geographical latitude by longitude are used. The First Guess Product of the monthly precipitation anomaly is based on interpolated precipitation anomalies from about 6,000 stations worldwide. Data sources are synoptic weather observation data (SYNOP) received at DWD via the WMO Global Telecommunication System (GTS) and climatic mean (mainly 1961-1990) monthly precipitation totals at the same stations extracted from GPCC s global normals collection. An automatic-only quality-control (QC) is applied to these data. Since September 2003, GPCC First Guess monthly precipitation analyses are available within 5 days after end of an observation month.
-
Maps on monthly total rainfall amount (in millimeters) and monthly rainfall percentage of normals 1961-1990 (in percentage) from August 2004 to October 2008 are available here for download for Eastern Africa. Rainfall data are also available in GeoNetwork for the whole African continent and the following Regions : Northern Africa, Western Africa, and Southern Africa. An interpolation method (Kriging) is applied to input data. Data input for rainfall maps are provided by Global Precipitation Climatology Centre (GPCC) operated by the Deutscher Wetterdienst (DWD, National Meteorological Service of Germany). GPCC First Guess Product, gauge-based gridded monthly precipitation data sets for the global land surface, at spatial resolutions of 1.0 x 1.0 degrees geographical latitude by longitude are used. The First Guess Product of the monthly precipitation anomaly is based on interpolated precipitation anomalies from about 6,000 stations worldwide. Data sources are synoptic weather observation data (SYNOP) received at DWD via the WMO Global Telecommunication System (GTS) and climatic mean (mainly 1961-1990) monthly precipitation totals at the same stations extracted from GPCC s global normals collection. An automatic-only quality-control (QC) is applied to these data. Since September 2003, GPCC First Guess monthly precipitation analyses are available within 5 days after end of an observation month.