 FAO Map Catalog
Type of resources
Available actions
Topics
Keywords
Contact for the resource
Provided by
Years
Formats
Representation types
Update frequencies
status
Scale
Resolution
-
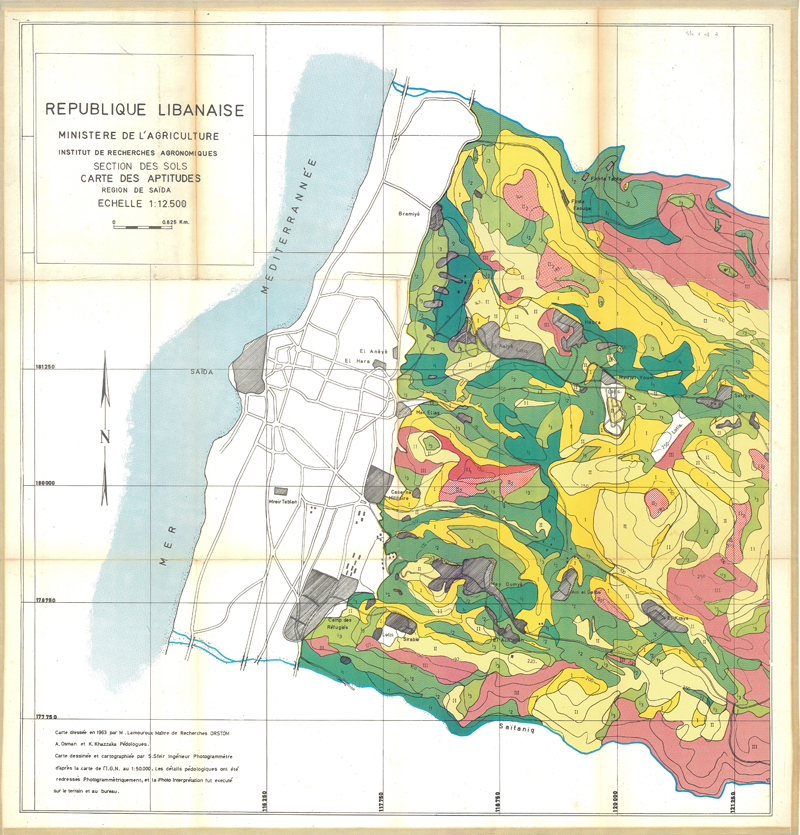
Lebanon Land suitability map : Saida> Description of the mapping units
-
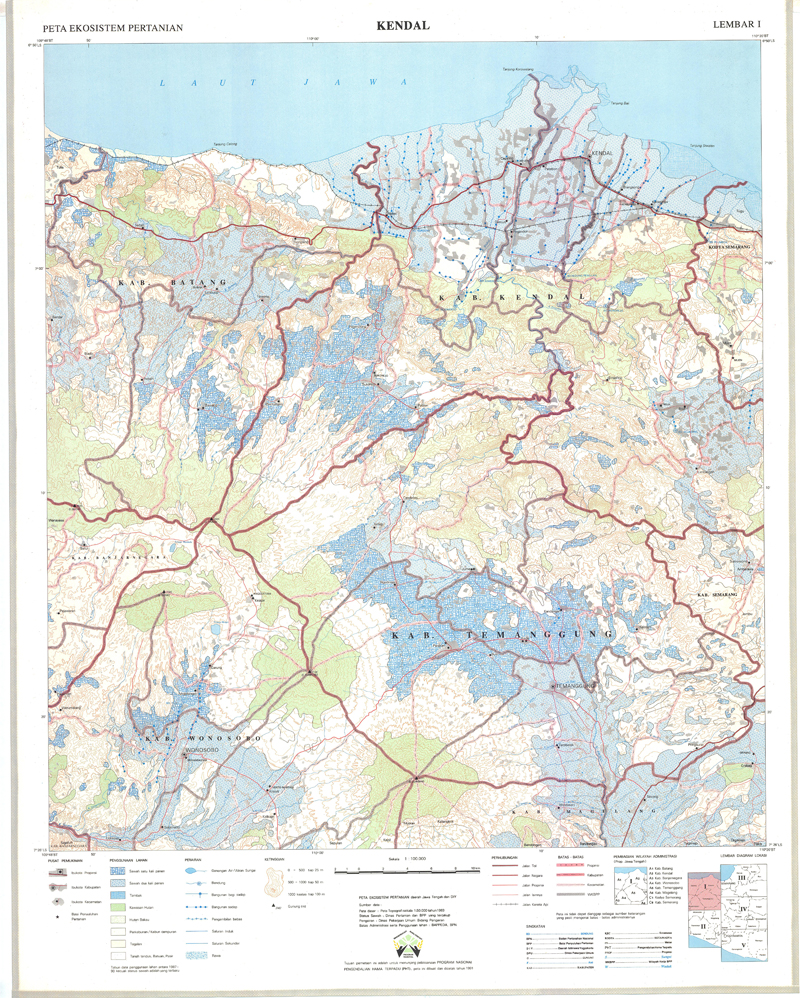
Include: Kendal (1991) (Lembar I)
-

The seasonal Gross Biomass Water Productivity expresses the quantity of output (above ground biomass production) in relation to the total volume of water consumed (actual Evapotranspiration) during the growing cycle of the vegetation. By relating biomass production to total Evapotranspiration (sum of soil evaporation, canopy transpiration and interception), this indicator provides insights on the impact of vegetation development on consumptive water use and thus on water balance in a given domain. When the focus is on monitoring performance of irrigated agriculture in relation to water consumption, it is more appropriate to use transpiration alone as a denominator, as a measure of water beneficially consumed by the plant. This latter indicator, for which we use the term \"net water productivity\", provides useful information on how effectively vegetation (and particularly crops) uses water to develop its biomass (and thus yield). The data is provided in near real time from January 2009 to present.
-
**Table content** - Year - Indicator - Item - Region - Value - Flag - Unit **Value assigned to No-data**:m
-

The raster dataset consists of a 500 m score grid for fruits storage location, produced under the scope of FAO’s Hand-in-Hand Initiative, Geographical Information Systems - Multicriteria Decision Analysis for value chain infrastructure location. The location score is achieved by processing sub-model outputs that characterize logistical factors for selected crop warehouse locations: • Supply: Cassava. • Demand: Human population density, Major cities population (national and bordering countries). • Infrastructure/accessibility: main transportation infrastructure. It consists of an arithmetic weighted sum of normalized grids (0 to 100): ("Crop Production" * 0.3) + (“Major Cities Accessibility” * 0.2) + (”Poverty” * 0.1) + ("Human Population Density" * 0.1) + (“Regional Cities Accessibility” * 0.1) +(“Port Accessibility” * 0.2)
-
Evapotranspiration from precipitation calculated for the Malaprabha (K4) sub-basin area. The Evapotranspiration from precipitation (etrain) is the evapotranspiration of green water, in other words the fraction of the total evapotranspiration that is due to rainfall. The calculation is based on a pixel-based soil moisture balance model. More information can be found on the IHE Delft Water Accounting report of Karnataka.
-

The 500m raster dataset represents selected top location score areas filtered by exclusive criteria: access to finance, distance to major roads, access to IT and distance to urban areas. The layer was produced under the scope of FAO’s Hand-in-Hand Initiative, Geographical Information Systems - Multicriteria Decision Analysis for value chain infrastructure location. The location score is achieved by processing sub-model outputs characterizing logistical factors for dairy processing (UHT/milk powder) facilities siting: Supply, demand, Infrastructure/accessibility. The top 99th percentile is selected/clipped using the exclusive criteria. Access to finance, distance to roads and urban areas are defined using a linear distance threshold: • Banks - approx. 20km (0.18 degree) buffer radius. • Major roads - approx. 2km (0.018 degree) buffer radius. Access to IT is characterized applying the mobile broadband coverage map.
-
The Transpiration (T) data component is the actual transpiration of the vegetation canopy. The value of each pixel represents the total annual transpiration for that specific year. The data is provided in near real time from January 2009 to present.
-
Include: Carte des aptitudes des sols aux cultures irriguées
-
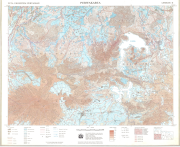
Include: Purwakarta (1990) (Lembar II)