 FAO Map Catalog
30 arc/sec
Type of resources
Available actions
Topics
Keywords
Contact for the resource
Provided by
Years
Formats
Representation types
Update frequencies
status
Resolution
-

The “natural sensitivity index” relates to the ecological component of sensitivity in 2010 and it is linked to the degree of stress over the ecological systems that sustain the agriculture production. It results from the combination of three underlying indexes: the “natural resources sensitivity index”, the “agriculture resources sensitivity index” and the “water stress index”. These original indexes represent the three principal component identified by Principal Component Analysis among 16 potential variables. The analysis calculated the weights of the three underlying index as 0.45, 0.35 and 0.20 for the “natural resources sensitivity index”, the “agriculture resources sensitivity index” and the “water stress index” respectively. This dataset has been produced in the framework of the “Climate change predictions in Sub-Saharan Africa: impacts and adaptations (ClimAfrica)” project, Work Package 4 (WP4). More information on ClimAfrica project is provided in the Supplemental Information section of this metadata.
-

The “rurality index” represents the level of dependence, thus fragility, of a certain region to agriculture and rural means of livelihood in 2010. A population strongly dependent from agriculture is subject to suffer larger consequences from agriculture productivity drop due to climatic alteration than a population less dependent by rural livelihood means. The index results from the first cluster of the Principal Component Analysis preformed among 14 potential variables. The analysis identify four dominant variables, namely “rural population density”, “dietary supply”, “dependency ratio” and “agriculture share GDP”, assigning a weight of 0.22 to the “rural population density” and 0.26 to the other three variables. Before to perform the analysis the variable “rural population density” was log transformed to shorten the extreme variation and then with the other variables were score-standardized (converted to distribution with average of 0 and standard deviation of 1; “dietary supply” with inverse method) in order to be comparable. The 5 arc-minutes grid “rural population density” of 2000 was collected from FAO GeoNetwork, sampled at 0.5 arc-minutes and then the values were adjusted in order to have national rural population totals equal to the 2010 values reported by the World Urbanization Prospects, the 2011 Revision. The 0.5 arc-minutes grid “dependency ratio” was calculated from the 2010 age distribution population for Africa produced by Worldpop Project computing the number of people with less than 15 years old or older than 65 years old per 100 people. The values were adjusted to the country total reported by the UN Population and Demographic Office estimation (World Population Prospect - the 2012 Revision). The country based value for “agriculture share GDP” and “dietary supply” were collected from World Bank and FAO statistics. The values reported are the average of the period 2008-2012. Tabular data were linked by country to the national boundaries shapefile (FAO/GAUL) and then converted into raster format (resolution 0.5 arc-minute). Rural population, or population with large number of dependent people are more fragile (i.e. sensible) to climatic stress, due to impact on food production. Similarly, high reliance on agriculture’s contribution to national GDP, makes country more susceptible to climate risk. Finally, populations with scarce dietary supply are more sensitive to climate impact on food production, because already affected by food supply concerns. This dataset has been produced in the framework of the “Climate change predictions in Sub-Saharan Africa: impacts and adaptations (ClimAfrica)” project, Work Package 4 (WP4). More information on ClimAfrica project is provided in the Supplemental Information section of this metadata.
-
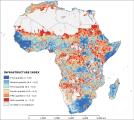
The “infrastructure index” describes the degree of development of physical facilities and networks in a certain area in 2010. The quality of infrastructure is an important measure of the relative adaptive capacity of a region. Regions with developed infrastructure systems are presumed to be better able to adapt to climatic stresses. Improved infrastructure may reduce transactions costs, and strengthen the links between labor and product markets. Moreover, improved infrastructure should encourage the formation of non-farm enterprises as a source of diversification in the short run and, eventually, a transition out of agriculture. The index results from the second cluster of the Principal Component Analysis preformed among 10 potential variables. The analysis identifies three dominant variables, namely “road density”, “road availability” and “infrastructure poverty”, assigning weights of 0.47, 0.36 and 0.17, respectively. Before to perform the analysis all variables were log transformed to shorten the extreme variation and then were score-standardized (converted to distribution with average of 0 and standard deviation of 1) in order to be comparable. A shapefile of road network was published by the Center for International Earth Science Information Network of Columbia University in 2013. The “road density” was computed by calculating the Kilometers of road per cell (size 0.5 arc-minute) and then running a focal statistic (radius of about 30 km to spread the effect of a transportation network in a neighborhood). The “road availability” is the road density divided by the logarithm of population. The 0.5 arc-minute grid “infrastructure poverty” is based on the average lights per pixel in 2010, which was produced by NOAA National Geophysical Data Center, divided by the logarithm of population. The original data was highly fragmented and at fine resolution may have contained fine-scale artifacts at urban edges due to data mismatch between the population and night-lights datasets. Thus focal statistics ran within 20 Km to calculate an average values and represents some of the extend influence of the infrastructure network for local people. The density and availability of road is a normally accepted indicator of infrastructure development degree. Moreover, developed road network facilitate the diffusion of rural products to large markets enhancing the income of rural population and sharing the risk of crisis among larger area. The average night light density per capita represents the diffusion of electricity among population and here is considered a proxy of diffusion of developed infrastructural network. This dataset has been produced in the framework of the “Climate change predictions in Sub-Saharan Africa: impacts and adaptations (ClimAfrica)” project, Work Package 4 (WP4). More information on ClimAfrica project is provided in the Supplemental Information section of this metadata.
-

The “human sensitivity index” represents the social component of sensitivity in 2010 and it is related to the degree to which a human society is dependent from the agriculture production. It derived from the combination of three underlying indexes: the “rurality index”, the “malnourishment index” and the “gender gap index”. These original indexes resulted from Principal Component Analysis among 14 potential variables, and they represent the three principal component highlighted by such analysis. The analysis allowed compute the weights for the three underlying index as 0.5, 0.3 and 0.2 for the “rurality index”, the “malnourishment index” and the “gender gap index” respectively. This dataset has been produced in the framework of the “Climate change predictions in Sub-Saharan Africa: impacts and adaptations (ClimAfrica)” project, Work Package 4 (WP4). More information on ClimAfrica project is provided in the Supplemental Information section of this metadata.
-
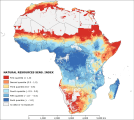
The “natural resources sensitivity” symbolizes the ecosystem vitality and degree of conservation in 2010. Deforestation and loss of water resources quality may render certain areas more sensitive to climate stressors on account of the loss of normal vegetation cover, the depletion of biodiversity, the reduction in ecosystem services and significant loss of beneficial assets. The index results from the first cluster of the Principal Component Analysis preformed among 16 potential variables. The analysis identify five dominant variables, namely “water availability per capita”, “net primary production”, “forest accessibility”, “vegetation continuity” and “climatic resources availability”, assigning respectively the weights of 0.19, 0.21, 0.165, 0.21 and 0.225. Before to perform the analysis the variables “water availability per capita”, “forest accessibility” and “vegetation continuity” were log transformed to shorten the extreme variation and then together with the other two variables were score-standardized (converted to distribution with average of 0 and standard deviation of 1; all variables with inverse method) in order to be comparable. The 6 arc-minute grid “water availability per capita” of 2005 was computed by sum of the run-off and discharge grids produced by World Water Development Report II and then sampled at 0.5 arc-minutes. A focal statistic ran with a radius of 55 cells (about 50 Km). This had a smoothing effect and represents some of the extend influence of major rivers as a resources for local people. To calculate the available water per capita it was then divided by the population. The 5 arc-minute grid “net primary production” of 2000 was gathered from FAO GeoNetwork and sampled at 0.5 arc-minute. Also in this case a focal statistic ran with a radius of 22 cells (about 20 Km) in order to represents the extend effect of primary production as natural resources for local people. The 0.5 arc-minute grid “forest accessibility” was build using the grid of travel distance in minutes to large cities (which one with population greater than 50,000 people), produced by the European Commission and the World Bank to represent the connectivity in 2000, and the grid of forest occurrence, extracted from the FAO Global Land Cover-SHARE dataset of 2014. The result measures the distance in minutes between forest and cities, thus is a proxy for remoteness and naturalness of forest. The 0.125 arc-minute grid “vegetation continuity” of 2010 were collected from University of Maryland and NASA and sampled at 0.5 arc-minute. A focal statistic ran with a radius of 55 cells (about 50 Km). This had a smoothing effect and represents some of the extend influence of vegetation concentration as a resources for local people. Finally the 0.5 arc-minute grid “climatic resources availability” was produced within the ClimAfrica project. The “water availability per capita” represents the potential water available per people in a certain area. We can consider the area with small values more sensitive to climatic stress, because lack a buffer of water resources, precious in a prevalently rain-fed agricultural system like in Africa. The “net primary production” and the “vegetation continuity” are proxies of the potential vegetal productivity available in a certain area. Moreover “vegetation continuity” is an indicator of abundance of natural ecosystem services that can reduce the sensitivity of human-environment systems. The “forest accessibility” assessing the distance between human and natural system measure the anthropogenic degree of a forest. A forest recording a high anthropogenic degree (thus near in terms of minute from a city) may potentially be threaded by human activity and thus represent a fragile ecosystem. Finally the “climatic resources availability” is an indicator of the climatic potential for biomass production. It is based on the climatically determined biomass productivity index that is a proxy for the atmospheric energy available for biomass production, as expressed by accumulated temperature, adjusted for drought stress. This dataset has been produced in the framework of the “Climate change predictions in Sub-Saharan Africa: impacts and adaptations (ClimAfrica)” project, Work Package 4 (WP4). More information on ClimAfrica project is provided in the Supplemental Information section of this metadata.
-

The “malnourishment index” relates to the degree of food insecurity of a certain region in 2010. A community characterized by scarce food quality supply and thus subject to malnutrition and starvation of large part of its members is prone to suffer from climate change impact on food production. The index results from the second cluster of the Principal Component Analysis preformed among 14 potential variables. The analysis identify four dominant variables, namely “percentage of underweighted children”, “percentage of stunted children”, “diet diversification index” and “animal protein supply”, assigning a weight of 0.25 to the “percentage of underweighted children” and the “percentage of stunted children”, 0.3 to the “animal protein supply” and 0.2 to the “diet diversification index”. Before to perform the analysis the variables were score-standardized (converted to distribution with average of 0 and standard deviation of 1; “diet diversification index” and “animal protein supply” with inverse method) in order to be comparable. The first administrative level data for “percentage of underweighted children” (more than two standard deviations below the mean weight-for-age score of the NCHS/CDC/WHO international reference population) and “percentage of stunted children” (more than two standard deviations below the mean height-for-age score of the NCHS/CDC/WHO international reference population) were derived from the Global Database on Child Growth and Malnutrition of WHO/UNICEF (data range from 1998 to 2012). When subnational data were not available, were used the national values from UNICEF database. Such national figures were used also to normalize to 2010 the values recorded by WHO/UNICEF. Tabular data were linked by first administrative unit to the first administrative boundaries shapefile (FAO/GAUL) and then converted into raster format (resolution 0.5 arc-minute). The country based values for the other two variables were collected from FAO statistics like the average of the period 2008-2012. Tabular data were linked by country to the national boundaries shapefile (FAO/GAUL) and then converted into raster format (resolution 0.5 arc-minute). Malnourishment illustrates the problems of food insecurity and hunger of a population, which has serious consequences on people's physical condition and very negative impacts on the mental and physical development of children. Countries which have worst diet parameters are more sensitive to the effects of the climate change. Indeed low animal protein consumption and low diet diversification (dominated by cereals) are indicators of the lack of alternative food source than local cereals production. This dataset has been produced in the framework of the “Climate change predictions in Sub-Saharan Africa: impacts and adaptations (ClimAfrica)” project, Work Package 4 (WP4). More information on ClimAfrica project is provided in the Supplemental Information section of this metadata.
-

The “water stress index” relates to the water sensitivity of a certain area in 2010. This potential is measured the water consumption and its relation to water availability and by the volume of rainfall available per people in crop land areas. The index results from the third cluster of the Principal Component Analysis preformed among 16 potential variables. The analysis identify two dominant variables, namely “water consumption per capita” and “water stress”, assigning respectively the weights of 0.58 and 0.42. Before to perform the analysis the variable “water consumption per capita” were log transformed to shorten the extreme variation. All the variables were score-standardized (converted to distribution with average of 0 and standard deviation of 1) in order to be comparable. Three 30 arc-minute grids “water consumption” (industrial, agriculture and domestic) of 2000, produced by World Water Development Report II, were sampled at 0.5 arc-minute and then summed and divided by population to calculate the level of water consumption per capita. The 0.5 arc-minute grid “water stress” were computed dividing the water consumption by the water availability (The 6 arc-minute grid “water availability per capita” of 2005 was computed by sum of the run-off and discharge grids produced by World Water Development Report II and then sampled at 0.5 arc-minutes. A focal statistic ran with a radius of 55 cells (about 50 Km). This had a smoothing effect and represents some of the extend influence of major rivers as a resources for local people). The “water consumption per capita” is an indicator of sensitivity because areas with large water consumption are more sensitive to future water shortage. The “water stress” identifies which areas are actually facing water deficit and thus likely will suffer water shortage in future due to climate change. This dataset has been produced in the framework of the “Climate change predictions in Sub-Saharan Africa: impacts and adaptations (ClimAfrica)” project, Work Package 4 (WP4). More information on ClimAfrica project is provided in the Supplemental Information section of this metadata.
-

The “element at risk index” describes the distribution in 2010 of the density of element (i.e. people, livestock unit or crop land) that are potentially threaded by climatic stress. When a climatic stress impact a densely populated (in terms of element at risk) the impact is likely to be more severe than it would be in areas with fewer element. The index results from the second cluster of the Principal Component Analysis (PCA) performed among potential 10 variables. The analysis identify three dominant variables, namely “people”, “livestock unit” and “crop land”, assigning a weight of 0.3 to people and weights of 0.35 to the other two variables. Before to perform the analysis the variables were log transformed to shorten the extreme variation and then score-standardized (converted to distribution with average of 0 and standard deviation of 1) in order to be comparable. The 0.5 arc-minute grid of population distribution in 2010 were gathered from Worldpop project website. The methodological approach used by Worldpop Project is described in Tatem et al 2007 (DOI: 10.1371/journal.pone.0001298). The values were adjusted in order to have national population totals equal to the UN Population and Demographic Office estimation per Country (World Population Prospect - the 2012 Revision). The 3 arc-minute grid of livestock distribution were gathered from FAO GeoNetwork (cattle, sheep, goats, pigs and poultry distribution), sampled at 0.5 arc-minute. The values were adjusted to national total livestock abundance in 2010 (FAO stats). The single species abundances were converted to livestock unit (LSU) according FAO methodology. The 0.5 arc-minute grid of crop land distribution were collected from FAO Global Land Cover-SHARE of 2014. The area with less than 1 people and 1 LSU for cell (about 1 Km square) and without cropland were masked and removed from the analysis for all layer because considered not exposed to climatic stress. This dataset has been produced in the framework of the “Climate change predictions in Sub-Saharan Africa: impacts and adaptations (ClimAfrica)” project, Work Package 4 (WP4). More information on ClimAfrica project is provided in the Supplemental Information section of this metadata.
-
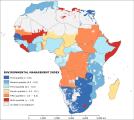
The “environmental management index” symbolize the impacts of institutional management on ecosystem and thus the ability of state institution to enhance the resilience to environmental and climate change in 2010. Institution able to manage efficiently the biodiversity and habitat conservation and to administer water related problems may have the capacity to face the impact of climate change on agriculture and water resources. Moreover ecosystem diversity and conservation is an indicator of environmental health, which maintains environmental services and natural balance among species. These ecological qualities are useful for communities when trying to keep or improve adaptation processes. The index results from the third cluster of the Principal Component Analysis preformed among 18 potential variables. The analysis identifies two dominant variables, namely “habitat and biodiversity management” and “water management”, assigning weights of 0.6 and 0.4, respectively. Before to perform the analysis the variables were log transformed to shorten the extreme variation and then were score-standardized (converted to distribution with average of 0 and standard deviation of 1) in order to be comparable. The country based values of the two variables were obtained from sub-indicators of the Environmental Performance Index (EPI) developed by Yale University. The “habitat and biodiversity management” includes four indicators: Critical Habitat Protection, Terrestrial Protected Areas (National Biome Weight), Terrestrial Protected Areas (Global Biome Weight), and Marine Protected Areas, whereas the “water management” include the only Wastewater treatment indicator. The data represents the averaged value for the period 2008-2012. EPI indicators use a “proximity-to-target” methodology, which assesses how close a particular country is to an identified policy target. Thus, scores are on a scale of 0 to 100 by simple arithmetic calculation, with 0 being the farthest from the target and 100 being closest to the target. This dataset has been produced in the framework of the “Climate change predictions in Sub-Saharan Africa: impacts and adaptations (ClimAfrica)” project, Work Package 4 (WP4). More information on ClimAfrica project is provided in the Supplemental Information section of this metadata.
-
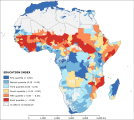
The “education index” represents the potential of a population to access information and knowledge in a certain area in 2010. Such potential is measured by the capacity of educational system and the diffusion of knowledge about events that impacts local population (as likely climate change will do). The index results from the second cluster of the Principal Component Analysis preformed among 16 potential variables. The analysis identify three dominant variables, namely “adult literacy”, “primary gross enrolment rate” and “prevalence of HIV”, assigning respectively the weights of 0.40, 0.25 and 0.35. Before to perform the analysis all the variables were log transformed (except “primary gross enrolment rate”) to shorten the extreme variation and then were score-standardized (converted to distribution with average of 0 and standard deviation of 1; with inverse method for “prevalence of HIV”) in order to be comparable. The first administrative level data for the “adult literacy” (percentage of population aged 15 years and older who can, with understanding, read and write a short, simple statement on their everyday lives), “primary gross enrolment rate” (total enrollment in primary education, regardless of age, expressed as a percentage of the population of official primary education age. GER can exceed 100% due to the inclusion of over-aged and under-aged students because of early or late school entrance and grade repetition) and “prevalence of HIV” (percentage of people ages 15-49 who are infected with HIV) were derived using survey data collected between 1998 and 2012 from DHS, UNDP National Human Development Reports, UNICEF statistics, and in some cases national survey data. Tabular data were linked by first administrative unit to the first administrative boundaries shapefile (FAO/GAUL) and then converted into raster format (resolution 0.5 arc-minute). Adult literacy rate shows the accumulated achievement of primary education and basic literacy skills of the population crucial for economic, social and political participation and development, especially in today’s knowledge societies. The gross enrolment ratio (GRE) is vital indicators that capture adaptive capacity, as they measure education access and coverage. They show the general level of participation in a given level of education and further indicate the capacity of the education system to enroll students of a particular age group. According to Leichenko et al. (2002), increased overall literacy levels reduce vulnerability by increasing people’s capabilities and access to information, thereby enhancing their ability to cope with adversities. Those without literacy skills may have problems taking advantage of health, educational, political, economic and cultural opportunities. Illiterate people may have difficulty in understanding warnings and access to recovery information. Other researches already combine HIV and education parameters to calculate index of adaptive capacity (Gbetibouo and Ringler 2009). HIV prevalence is used as indicator under the assumption that areas with higher rates of HIV/AIDS are more vulnerable. This dataset has been produced in the framework of the “Climate change predictions in Sub-Saharan Africa: impacts and adaptations (ClimAfrica)” project, Work Package 4 (WP4). More information on ClimAfrica project is provided in the Supplemental Information section of this metadata.