 FAO Map Catalog
FAO - AGAL
Type of resources
Available actions
Topics
Keywords
Contact for the resource
Provided by
Years
Representation types
Update frequencies
status
Scale
-

The raster map was originally produced from a multivariate regression predicting animal distribution from census livestock statistics and satellite-derived information (mainly environment and land development). More information about the original layer and its calculation can be provided from Jan Slingenbergh (AGAH) [email protected] current map is an update of this previous one, based on more recent census data. The regression has not been updated.
-
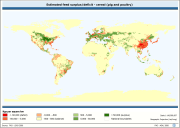
The map shows the estimated cereal feed surplus and deficit for use in both pig and poultry livestock production, at a resolution of 100 x 100 km cells, for the whole world.
-
Based on bovine density (FAO, 1999), livestock systems distribution, proportion of oxen in the cattle herd structures and system-specific information on the use of bovine draught power to estimate oxen-working days per km2. Part of a study "Cattle and small ruminant production systems in sub-Saharan Africa: a systematic review" (FAO, 2002).
-

Based on bovine density (FAO, 1999), livestock systems distribution, system-specific production parameters, calculations of output per animal to obtain milk production density (output per km2) were performed using the Livestock Development Planning System Version 2 model. Part of a study "Cattle and small ruminant production systems in sub-Saharan Africa: a systematic review" (FAO, 2002).
-

Based on bovine density (FAO, 1999), livestock systems distribution, system-specific production parameters, calculations of output per animal to obtain beef production density (output per km2) were performed using the Livestock Development Planning System Version 2 model. Part of a study "Cattle and small ruminant production systems in sub-Saharan Africa: a systematic review" (FAO, 2002).
-

Estimated distribution of the main ruminant prodution systems based on rainfall, length of growing period, cropping pattern and mean temperature during the growing period, Part of a study "Cattle and small ruminant production systems in sub-Saharan Africa: a systematic review" (FAO, 2002).
-

Based on bovine and human population densities (FAO, 1999), livestock systems distribution, system-specific production parameters, calculations of output per animal to obtain milk offtake per capita were performed using the Livestock Development Planning System Version 2 model. Part of a study "Cattle and small ruminant production systems in sub-Saharan Africa: a systematic review" (FAO, 2002).
-
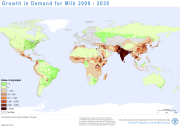
Livestock is one of the fastest-growing sectors in agriculture, potentially presenting opportunities for economic growth and poverty reduction in rural areas. Dealing with the important social, environmental and public health issues linked to sector growth will require solutions that embrace the way in which the livestock sector grows to meet the increasing demand for animal-source foods. It is then important to understand where growth in demand for livestock commodities is likely to occur, and how and where production of livestock commodities will be increased in order to meet it. Estimates of supply and demand for animal-source foods, provided by the Global Perspective Studies Unit at FAO, have been disaggregated spatially for the years 2000 and 2030. Demand for animal-source foods (beef, milk, mutton, pork, poultry meat and eggs) was mapped by estimating per-capita consumption and applying this to mapped population distributions in 2000. Population maps were produced for 2030 based on projected population growth and urbanisation rates and future estimates of per-capita demand applied to these. Similarly, livestock production maps were produced by spatially disaggregating the estimated production based on maps of the relevant livestock species. Methods and results are presented in the forthcoming FAO working paper âMapping Supply and Demand for Animal-Source Foods to 2030 (by T.P. Robinson and F. Pozzi, 2011). Grids and tabular data are distributed here by livestock product and by continent.
-
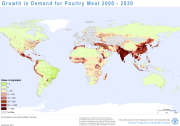
Livestock is one of the fastest-growing sectors in agriculture, potentially presenting opportunities for economic growth and poverty reduction in rural areas. Dealing with the important social, environmental and public health issues linked to sector growth will require solutions that embrace the way in which the livestock sector grows to meet the increasing demand for animal-source foods. It is then important to understand where growth in demand for livestock commodities is likely to occur, and how and where production of livestock commodities will be increased in order to meet it. Estimates of supply and demand for animal-source foods, provided by the Global Perspective Studies Unit at FAO, have been disaggregated spatially for the years 2000 and 2030. Demand for animal-source foods (beef, milk, mutton, pork, poultry meat and eggs) was mapped by estimating per-capita consumption and applying this to mapped population distributions in 2000. Population maps were produced for 2030 based on projected population growth and urbanisation rates and future estimates of per-capita demand applied to these. Similarly, livestock production maps were produced by spatially disaggregating the estimated production based on maps of the relevant livestock species. Methods and results are presented in the forthcoming FAO working paper âMapping Supply and Demand for Animal-Source Foods to 2030 (by T.P. Robinson and F. Pozzi, 2011). Grids and tabular data are distributed here by livestock product and by continent.