 FAO Map Catalog
temperature
Type of resources
Available actions
Topics
Keywords
Contact for the resource
Provided by
Years
Formats
Representation types
Update frequencies
status
Scale
Resolution
-
This map is part of a series of global climate images produced by the Agrometeorology Group and based on data for mean monthly values of temperature, precipitation and cloudiness prepared in 1991 by R. Leemans and W. Cramer and published by the International Institute for Applied Systems Analysis (IIASA). For each of the weather stations used data have been assembled over a long time period - usually between 1961 and 1990 - and then averaged.
-

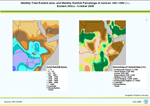
Maps on monthly total rainfall amount (in millimeters) and monthly rainfall percentage of normals 1961-1990 (in percentage) from August 2004 to October 2008 are available here for download for Southern Africa. Rainfall data are also available in GeoNetwork for the whole African continent and the following Regions : Northern Africa, Western Africa, and Eastern Africa. An interpolation method (Kriging) is applied to input data. Data input for rainfall maps are provided by Global Precipitation Climatology Centre (GPCC) operated by the Deutscher Wetterdienst (DWD, National Meteorological Service of Germany). GPCC First Guess Product, gauge-based gridded monthly precipitation data sets for the global land surface, at spatial resolutions of 1.0 x 1.0 degrees geographical latitude by longitude are used. The First Guess Product of the monthly precipitation anomaly is based on interpolated precipitation anomalies from about 6,000 stations worldwide. Data sources are synoptic weather observation data (SYNOP) received at DWD via the WMO Global Telecommunication System (GTS) and climatic mean (mainly 1961-1990) monthly precipitation totals at the same stations extracted from GPCC s global normals collection. An automatic-only quality-control (QC) is applied to these data. Since September 2003, GPCC First Guess monthly precipitation analyses are available within 5 days after end of an observation month.
-
Maps on monthly total rainfall amount (in millimeters) and monthly rainfall percentage of normals 1961-1990 (in percentage) from August 2004 to October 2008 are available here for download for Northern Africa. Rainfall data are also available in GeoNetwork for the whole African continent and the following Regions : Western Africa, Eastern Africa and Southern Africa. An interpolation method (Kriging) is applied to input data. Data input for rainfall maps are provided by Global Precipitation Climatology Centre (GPCC) operated by the Deutscher Wetterdienst (DWD, National Meteorological Service of Germany). GPCC First Guess Product, gauge-based gridded monthly precipitation data sets for the global land surface, at spatial resolutions of 1.0 x 1.0 degrees geographical latitude by longitude are used. The First Guess Product of the monthly precipitation anomaly is based on interpolated precipitation anomalies from about 6,000 stations worldwide. Data sources are synoptic weather observation data (SYNOP) received at DWD via the WMO Global Telecommunication System (GTS) and climatic mean (mainly 1961-1990) monthly precipitation totals at the same stations extracted from GPCC s global normals collection. An automatic-only quality-control (QC) is applied to these data. Since September 2003, GPCC First Guess monthly precipitation analyses are available within 5 days after end of an observation month.
-
The Food and Agriculture Organization of the United Nations (FAO) with the collaboration of the International Institute for Applied Systems Analysis (IIASA), has developed a system that enables rational land-use planning on the basis of an inventory of land resources and evaluation of biophysical limitations and potentials. This is referred to as the Agro-ecological Zones (AEZ) methodology.
-

Maps on monthly total rainfall amount (in millimeters) and monthly rainfall percentage of normals 1961-1990 (in percentage) from August 2004 to October 2008 are available here for download for Western Africa. Rainfall data are also available in GeoNetwork for the whole African continent and the following Regions : Northern Africa, Western Africa, Eastern Africa and Southern Africa. An interpolation method (Kriging) is applied to input data. Data input for rainfall maps are provided by Global Precipitation Climatology Centre (GPCC) operated by the Deutscher Wetterdienst (DWD, National Meteorological Service of Germany). GPCC First Guess Product, gauge-based gridded monthly precipitation data sets for the global land surface, at spatial resolutions of 1.0 x 1.0 degrees geographical latitude by longitude are used. The First Guess Product of the monthly precipitation anomaly is based on interpolated precipitation anomalies from about 6,000 stations worldwide. Data sources are synoptic weather observation data (SYNOP) received at DWD via the WMO Global Telecommunication System (GTS) and climatic mean (mainly 1961-1990) monthly precipitation totals at the same stations extracted from GPCC s global normals collection. An automatic-only quality-control (QC) is applied to these data. Since September 2003, GPCC First Guess monthly precipitation analyses are available within 5 days after end of an observation month.
-
Annual mean temperature in Djibouti, Eritrea, Ethiopia, Kenya, Somalia, Sudan and Uganda.
-
Maps on monthly total rainfall amount (in millimeters) and monthly rainfall percentage of normals 1961-1990 (in percentage) from August 2004 to October 2008 are available here for download for Eastern Africa. Rainfall data are also available in GeoNetwork for the whole African continent and the following Regions : Northern Africa, Western Africa, and Southern Africa. An interpolation method (Kriging) is applied to input data. Data input for rainfall maps are provided by Global Precipitation Climatology Centre (GPCC) operated by the Deutscher Wetterdienst (DWD, National Meteorological Service of Germany). GPCC First Guess Product, gauge-based gridded monthly precipitation data sets for the global land surface, at spatial resolutions of 1.0 x 1.0 degrees geographical latitude by longitude are used. The First Guess Product of the monthly precipitation anomaly is based on interpolated precipitation anomalies from about 6,000 stations worldwide. Data sources are synoptic weather observation data (SYNOP) received at DWD via the WMO Global Telecommunication System (GTS) and climatic mean (mainly 1961-1990) monthly precipitation totals at the same stations extracted from GPCC s global normals collection. An automatic-only quality-control (QC) is applied to these data. Since September 2003, GPCC First Guess monthly precipitation analyses are available within 5 days after end of an observation month.
-

The new globally gridded Koeppen climatologies are based on climatological observations (temperature and precipitations) rasterized to grids of 0.5 x 0.5 degrees. They cover 4 different periods and are based on 3 different precipitation datasets. This leads to a total number of 12 rasterized Koeppen climatologies. The 4 different periods are: 1. 1951 - 2000 (all), 2. 1961 - 1990 (norm), 3. 1951 - 1975 (early), 4. 1976 - 2000 (late). Source: Mean annual cycles of temperature are always taken from the Climatic Research Unit (CRU, Mitchell and Jones, 2005). Precipitation is taken from GPCC VASClimO data, based on 9,343 stations that provide at least 90% coverage within 1951-2000 (Beck, Grieser and Rudolf, 2005). All different datasets are converted to the same 0.5 x 0.5 grid, which results from USGS gtopo30. Antarctica and Greenland are left out due to lack of data. For further information on the global climate grids please refer to the FAO Climpag website at http://www.fao.org/nr/climpag/globgrids/KC_classification_en.asp.
-
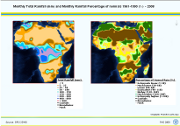
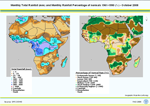
Maps on monthly total rainfall amount (in millimeters) and monthly rainfall percentage of normals 1961-1990 (in percentage) are available here for download from August 2004 to October 2008 for the African continent. Rainfall data are also available in GeoNetwork for the following Regions: Northern Africa, Western Africa, Eastern Africa and Southern Africa. An interpolation method (Kriging) is applied to input data. Data input for rainfall maps are provided by Global Precipitation Climatology Centre (GPCC) operated by the Deutscher Wetterdienst (DWD, National Meteorological Service of Germany). GPCC First Guess Product, gauge-based gridded monthly precipitation data sets for the global land surface, at spatial resolutions of 1.0 x 1.0 degrees geographical latitude by longitude are used. The First Guess Product of the monthly precipitation anomaly is based on interpolated precipitation anomalies from about 6,000 stations worldwide. Data sources are synoptic weather observation data (SYNOP) received at DWD via the WMO Global Telecommunication System (GTS) and climatic mean (mainly 1961-1990) monthly precipitation totals at the same stations extracted from GPCC s global normals collection. An automatic-only quality-control (QC) is applied to these data. Since September 2003, GPCC First Guess monthly precipitation analyses are available within 5 days after end of an observation month.
-
The Food and Agriculture Organization of the United Nations (FAO) with the collaboration of the International Institute for Applied Systems Analysis (IIASA), has developed a system that enables rational land-use planning on the basis of an inventory of land resources and evaluation of biophysical limitations and potentials. This is referred to as the Agro-ecological Zones (AEZ) methodology.