 FAO Map Catalog
pulses
Type of resources
Available actions
Topics
Keywords
Contact for the resource
Provided by
Years
Formats
Representation types
Update frequencies
status
Resolution
-
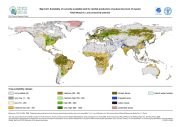
The FGGD crop suitability maps at low, intermediate and high levels of inputs under rainfed conditions on currently available land are global raster datalayers with a resolution of 5 arc-minutes. Pixels classified as urban, closed forest or irrigated contain values of zero. Each remaining pixel contains the 2005 version of the suitability index for rainfed production of the crop or crop group concerned. The method and crop coverage of each crop group are described in FAO and IIASA, 2007, Mapping biophysical factors that influence agricultural production and rural vulnerability, by H. von Velthuizen et al.
-

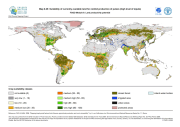
The FGGD crop suitability maps at low, intermediate and high levels of inputs under rainfed conditions on global land area are global raster datalayers with a resolution of 5 arc-minutes. Each pixel contains the 2005 version of the suitability index for rainfed production of the crop or crop group concerned. The method and crop coverage of each crop group are described in FAO and IIASA, 2007, Mapping biophysical factors that influence agricultural production and rural vulnerability, by H. von Velthuizen et al.
-
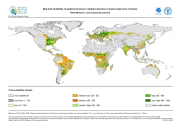
The FGGD crop suitability maps at low, intermediate and high levels of inputs under rainfed conditions on currently available land are global raster datalayers with a resolution of 5 arc-minutes. Pixels classified as urban, closed forest or irrigated contain values of zero. Each remaining pixel contains the 2005 version of the suitability index for rainfed production of the crop or crop group concerned. The method and crop coverage of each crop group are described in FAO and IIASA, 2007, Mapping biophysical factors that influence agricultural production and rural vulnerability, by H. von Velthuizen et al.
-

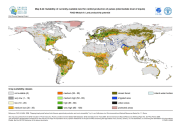
The FGGD crop suitability maps at low, intermediate and high levels of inputs under rainfed conditions on global land area are global raster datalayers with a resolution of 5 arc-minutes. Each pixel contains the 2005 version of the suitability index for rainfed production of the crop or crop group concerned. The method and crop coverage of each crop group are described in FAO and IIASA, 2007, Mapping biophysical factors that influence agricultural production and rural vulnerability, by H. von Velthuizen et al.
-
The FGGD crop suitability maps at low, intermediate and high levels of inputs under rainfed conditions on currently available land are global raster datalayers with a resolution of 5 arc-minutes. Pixels classified as urban, closed forest or irrigated contain values of zero. Each remaining pixel contains the 2005 version of the suitability index for rainfed production of the crop or crop group concerned. The method and crop coverage of each crop group are described in FAO and IIASA, 2007, Mapping biophysical factors that influence agricultural production and rural vulnerability, by H. von Velthuizen et al.
-
The suitability analysis allowed identifying a suitability weight to each crop, based on the climate conditions (ClimAfrica) outputs as well as on the soil quality. Both climate and soil classes have been combined in order to produce one suitability map for each crop and each 30-year period (historical, current, and the 3 future periods). This dataset has been produced in the framework of the “Climate change predictions in Sub-Saharan Africa: impacts and adaptations (ClimAfrica)” project, Work Package 4 (WP4). More information on ClimAfrica project is provided in the Supplemental Information section of this metadata.