 FAO Map Catalog
land suitability
Type of resources
Available actions
Topics
Keywords
Contact for the resource
Provided by
Years
Formats
Representation types
Update frequencies
status
-
Land suitability analysis map provides information about land suitability for different landscape restoration activities. In Cox’s Bazar, socio-economic and biophysical information about wood fuel demand and supply were used to assess gaps and needs in support to safe access to fuel and energy as well as to sustainable land degradation. Source: Bangladesh Forestry Department, FAO, IOM
-
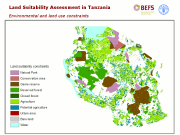
This map identifies areas that in Tanzania could not be available for bioenergy activities due to diverse constraints. In particular it shows the land already under agriculture production, protected or environmentally sensitive areas, urban settlements and bare land that have been excluded from the BEFS land suitability assessment of Tanzania, in order to get a true understanding of which lands are available for bioenergy production in this country. Data sources: FAO Africover (1995-2002), UNEP-WCMC and IUCN, 2008. All BEFS results have been reported in the FAO publication "Bioenergy and Food Security - The BEFS Analysis for Tanzania" and the final products made available in this catalogue.
-

Average attainable yield of current cropland for wheat, cotton and sugarcane under irrigated conditions and high input level, with and without CO2 fertilization, using different climate data source and based on different Representative Concentration Pathways (RCPs) according to the time period as follows: - climate data source CRUTS32 based on historical data for the time period 1981-2010; - climate data source ENSEMBLE based on the Representative Concentration Pathway RCP8.5 for time period 2041-2070. The Average attainable yield of current cropland dataset is part of the GAEZ v4 Suitability and Attainable Yield - Agro-Ecological Attainable Yield. For additional information, please refer to the GAEZ v4 Model Documentation.
-
Land cover map based on the U.S. Geological Survey (USGS) classification scheme.
-
Land cover map based on the International Geosphere Biosphere Programme (IGBP) classification scheme.
-
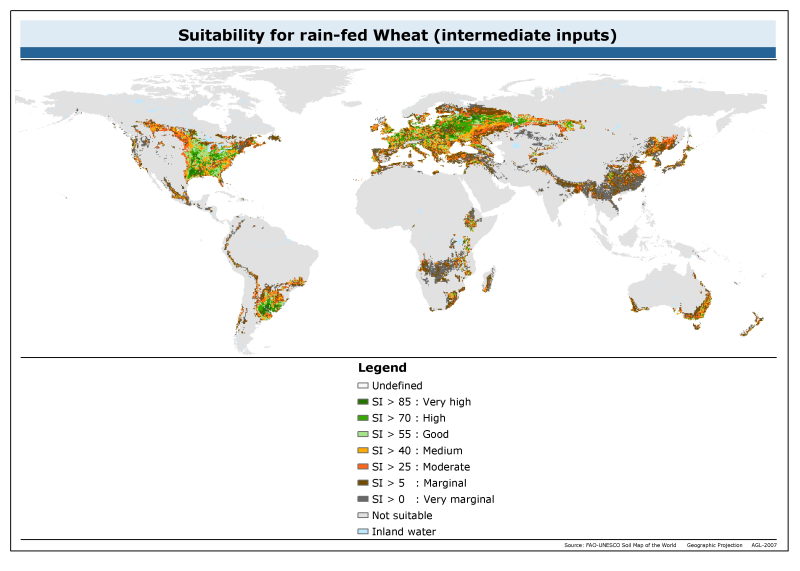
The raster dataset of suitability for rainfed wheat with intermediate inputs has a spatial resolution of 5 * 5 arc minutes and is in geographic projection. Information with regard to wheat suitability was obtained from the "Derived Soil Properties" of the FAO-UNESCO Soil Map of the World which contains raster information on soil properties.
-

Crop suitability index in classes, current cropland in grid cell for wheat, cotton and sugarcane under irrigated conditions and high input level, with and without CO2 fertilization, using different climate data source and based on different Representative Concentration Pathways (RCPs) according to the time period as follows: - climate data source CRUTS32 based on historical data for the time period 1981-2010; - climate data source ENSEMBLE based on the Representative Concentration Pathway RCP8.5 for time period 2041-2070. The Crop suitability index in classes dataset is part of the GAEZ v4 Suitability and Attainable Yield - Suitability Class. For additional information, please refer to the GAEZ v4 Model Documentation.
-
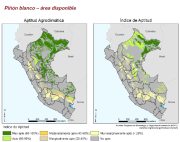
This dataset presents the result of the Bioenergy and Food Security (BEFS) analysis for Peru on land and agro-climatic suitability and availability for white pinon. In particular it reports the available area suitable for white pinon production at different levels of suitability, considering the conservation agriculture (CA) production system and low level of inputs. Land already under agriculture production or protected or environmentally sensitive has been excluded from the land suitability total area, in order to get a true understanding of which lands are available for bioenergy production in this country. Please note that the "Excluded areas" layers, used to identify areas that in Peru could not be available for bioenergy activities, are also available in this catalogue. You may find the link to them in the Distribution Information section of this metadata. The land suitability index categorizes the capability of a specific location to achieve the maximum attainable yield in percentage terms. The maximum attainable yield is defined as the harvested yield of a high-producing variety with “constraint-free†conditions (water, nutrients and pests and disease), which can be achieved under a specific production system and level of inputs. In Peru the analysis of Land Suitability Assessment (LSA) was held also for sugarcane and oil palm under two production systems, namely Tillage-based (TA) and Conservation agriculture (CA) and under low and high inputs. The two production systems and two input levels result in four agricultural configurations: 1 - Tillage-based at low inputs (TA-L) 2 - Tillage-based at high inputs (TA-H) 3 - Conservation agriculture at low inputs (CA-L) 4 - Conservation agriculture at high inputs (CA-H) Source data: MINAG, 2008. Series histórica de producción agrícola. http://frenteweb.minag.gob.pe/sisca/?mod=consulta_cult All BEFS results have been reported in the FAO publication “Bioenergía y seguridad alimentaria - El análisis de BEFS para el Perú - Compendio técnico Vol I y II†and the final products made available in this catalogue.
-
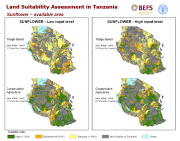
This dataset presents the result of the Bioenergy and Food Security (BEFS) analysis for Tanzania on land suitability and availability for sunflower. In particular it reports the available area suitable for sunflower production at different levels of suitability, considering specific production systems and level of inputs. Land already under agriculture production or protected or environmentally sensitive has been excluded from the land suitability total area, in order to get a true understanding of which lands are available for bioenergy production in this country. Please note that the "Excluded areas" layers, used to identify areas that in Tanzania could not be available for bioenergy activities, are also described in this catalogue. You may find the link to them in the Distribution Information section of this metadata. The land suitability index categorizes the capability of a specific location to achieve the maximum attainable yield in percentage terms. The maximum attainable yield is defined as the harvested yield of a high-producing variety with “constraint-free†conditions (water, nutrients and pests and disease), which can be achieved under a specific production system and level of inputs. This dataset shows the result of the assessment carried out for the sunflower under two production systems, namely Tillage-based (TA) and Conservation agriculture (CA) and under low and high inputs. The two production systems and two input levels result in four agricultural configurations: 1 - Tillage-based at low inputs (TA-L) 2 - Tillage-based at high inputs (TA-H) 3 - Conservation agriculture at low inputs (CA-L) 4 - Conservation agriculture at high inputs (CA-H) The BEFS analysis has also investigated the following crops for potential bioenergy development: cassava, palm oil, sweet sorghum and sugarcane. All BEFS results have been reported in the FAO publication “Bioenergy and Food Security - The BEFS Analysis for Tanzania†and the final products made available in this catalogue.
-
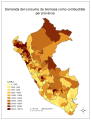
This map shows the spatial distribution of biomass consumption for biofuel, calculated by province. It illustrates as the biomass demand is concentrated in the dry forests of the northwest region and in the neighboring provinces of Cuzco and Junin. In the southern highlands instead, less consumption of biomass is reported because is poor the biomass production in this area. The province with the highest consumption of biomass is Viru (La Libertad) with more than 500 000 tonnes per year followed by Chota (Cajamarca), Morropon (Piura) and Tarma (Junín), among others. On the other side, the province with lower demand for biomass is Huancayo (Junin) with 658 t per year, followed by Tarata (Tacna) with 719 tons of annual consumption. The consumption of firewood and charcoal in Huancayo is traditional but is decreasing by the presence in the market of liquefied petroleum gas. This situation is not reflected in this result because the information provided by the corresponding authorities did not reveal this consumption. All values in this map are considered residential and commercial demand, not industrial. No data consumption of firewood and charcoal were found in the latter sector. It is presumed that there are informal brickworks which use in their processes fuelwood and charcoal. It is known that many brickworks utilize gas, but the location and the consumption of these factories have not been identified. The coal and firewood that Peru imports are used by some industries (calcium carbide, cyanide, and activated carbon, steel). The total imported by the country is known but since the statistics do not provide information as to spatially locate its consumption, it has not been considered in analyzing the imported quantities. Source data: - INEI, 2008. Perfil socioeconómico del Perú. 2da. Edición. Census Nacionales 2007. XI de población y VI de vivienda. Lima. This dataset is part of the result of the Bioenergy and Food Security (BEFS) analysis for Perú on land and agro-climatic suitability and availability for crops. All BEFS results have been reported in the FAO publication “Bioenergía y seguridad alimentaria - El análisis de BEFS para el Perú - Compendio técnico Vol I y II†and the final products made available in this catalogue.