 FAO Map Catalog
Livestock
Type of resources
Available actions
Topics
Keywords
Contact for the resource
Provided by
Years
Formats
Representation types
Update frequencies
status
Scale
Resolution
-
**Table content** - Year - Indicator - Species - Value - Flag - Unit
-
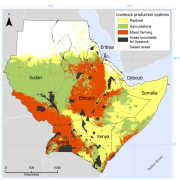
The dataset provides the distribution of pastoral, agro-pastoral and mixed farming systems in six countries of East Africa (Djibouti, Eritrea, Ethiopia, Kenya, Somalia, Sudan and Uganda). The production systems are defined according to the ratio of livestock- to crop-derived income. If L is defined as the total household income derived from livestock and C as the total household income derived from crops, then for pastoral production systems: L/C > 4; for agro-pastoral systems: 1 < L/C < 4; and for mixed farming systems L/C < 1. The map is based on datasets collected in the framework of livelihood analysis in the period 2000 and 2007. Input data were available for Djibouti, Eritrea, Kenya, Somalia, Uganda and parts of Ethiopia and Sudan. Data on these countries and regions provided the training data for the subsequent statistical analysis based on environmental and other geospatial predictors, which resulted in a full regional map. More detailed information on this datasets is available in “Geographic distribution and environmental characterization of livestock production systems in Eastern Africaâ€, 2009. Agriculture, Ecosystems & Environment, 135, 98-110.
-

The global livestock sector is rapidly changing in response to globalization and growing demand for animal-source foods, driven by population growth and increasing wealth in much of the developing world. As well as the many benefits and opportunities associated with rapid sector transformation and growth, they are also associated with social, environmental and public health risks. There are huge differences in the ways in which livestock are kept in different places and what their roles are. Hence, we need to develop a good understanding of the differences among production systems if we are to be able to help poor livestock keepers take advantage of the rising demand for animal-source foods, help livestock keepers adapt to a changing and more volatile climate; minimize the risk of disease emergence and spread, not only among livestock but also in people; and to help all livestock keepers mitigate greenhouse gas emissions via a wide range of options. The mapping of the Global Livestock Production System is the result of a a long-standing collaboration between FAO and the International Livestock Research Institute (ILRI). The first attempt to map livestock production systems, at least in the developing world, was by Thornton et al. in 2002, based on a classification scheme developed by Seré and Steinfeld in 1996. This version (2011) includes more accurate and higher spatial resolution (circa 1 km) input data and updates the FAO-ILRI previous version. Main reference for this 2011 map is the forthcoming publication of Robinson et al. (2011). This new book provides references to the most up to date map of global livestock production systems and revised estimates of the number of poor livestock keepers, globally, within the different production systems. It proposes alternative approaches to mapping production systems that are explicitly linked to livelihoods, and reviews the ways in which intensive production can be accounted for. The book also underscores the areas that need further development. The FAO and ILRI continue to work jointly on several of these. Data are distributed as ESRI grids.
-

The mapping system is the result of a collaborative initiative between FAO (AGAL - Animal Production and Health Division) and ILRI to develop a global, one kilometre resolution, GIS map of livestock production systems. The first attempt to map livestock production systems, at least in the developing world, was by Thornton et al. in 2002, based on a classification scheme developed by Seré and Steinfeld in 1996. This version includes more accurate and higher spatial resolution input data.
-

Based on bovine density (FAO, 1999), livestock systems distribution, system-specific production parameters, calculations of output per animal to obtain milk production density (output per km2) were performed using the Livestock Development Planning System Version 2 model. Part of a study "Cattle and small ruminant production systems in sub-Saharan Africa: a systematic review" (FAO, 2002).
-
Part of the Integrated Vulnerability Assessment in the Arab Region, this 1km pixel resolution raster dataset provides a representation of Sensitivity to climate change impact for the Natural dimension indicator – Livestock Density - in the Middle East and North Africa Region. Vulnerability is a concept used to express the complex interaction of climate change effects and the susceptibility of a system to its impacts. The integrated vulnerability assessment methodology is based on an understanding of vulnerability as a function of a system’s climate change exposure, sensitivity and adaptive capacity to cope with climate change effects, consistent with the approach put forward by the Intergovernmental Panel on Climate Change (IPCC) in its Fourth Assessment Report (AR4). Within this conceptual framework, Sensitivity provides information about the status quo of the physical and natural environment that makes the affected systems particularly susceptible to climate change. Sensitivity indicators were clustered into three dimensions: population, natural, and manmade. Within the vulnerability assessment methodology, it is assumed the indicators retain the same values for reference period and future periods. A class value of 1 was assigned to represent a favorable condition (low sensitivity) while a class value of 10 designates an unfavorable condition.
-

The 500m raster dataset represents selected top location score areas filtered by exclusive criteria: access to finance, distance to major roads, access to IT, and distance to urban areas. The layer was produced under the scope of FAO’s Hand-in-Hand Initiative, Geographical Information Systems - Multicriteria Decision Analysis for value chain infrastructure location. The location score is achieved by processing sub-model outputs characterizing logistical factors for the slaughterhouse facilities siting: Demand, Supply, Infrastructure/accessibility. The top 99th percentile is selected/clipped using the exclusive criteria. Access to finance, distance to roads and urban areas are defined using a linear distance threshold: • Banks - approx. 20km (0.18 degree) buffer radius. • Major roads - approx. 2km (0.018 degree) buffer radius. • Access to IT is characterized by applying the mobile broadband coverage map.
-

The raster dataset consists of a 500m score grid for slaughterhouse industry facilities siting, produced under the scope of FAO’s Hand-in-Hand Initiative, Geographical Information Systems - Multicriteria Decision Analysis for value chain infrastructure location. The analysis is based on goat production intensification potential defined using crop production, livestock production systems, and goat distribution. The score is achieved by processing sub-model outputs that characterize logistical factors: 1. Supply - Feed, livestock production systems, goat distribution. 2. Demand - Human population density, large cities, urban areas. 3. Infrastructure - Transportation network (accessibility). It consists of an arithmetic weighted sum of normalized grids (0 to 100): ("Crop Production" * 0.2) + ("Human Population Density" * 0.2) + (“Major Cities Accessibility” * 0.2) + (”Goat intensification” * 0.3) + (“Poverty” * 0.1)
-

The 500m raster dataset represents selected top location score areas filtered by exclusive criteria: access to finance, distance to major roads, access to IT and distance to urban areas. The layer was produced under the scope of FAO’s Hand-in-Hand Initiative, Geographical Information Systems - Multicriteria Decision Analysis for value chain infrastructure location. The location score is achieved by processing sub-model outputs characterizing logistical factors dairy processing facilities siting: Supply, demand, Infrastructure/accessibility. The top score is selected/clipped using the exclusive criteria. Access to finance, distance to roads and urban areas are defined using a linear distance threshold: • Banks - approx. 20km (0.18 degree) buffer radius. • Major roads - approx. 2km (0.018 degree) buffer radius. • Peri urban areas are defined as being less than approx. 10 km (0.09 degree) from urban (WHERE PopDens>1500 AND area larger than 25 km²). Access to IT is characterized applying the mobile broadband coverage map.
-

The raster dataset consists of a 500 m score grid for slaughterhouse industry facilities, produced under the scope of FAO’s Hand-in-Hand Initiative, Geographical Information Systems - Multicriteria Decision Analysis for value chain infrastructure location. The analysis is based on livestock production potential using proximity to cities, crop production, and aggregated density of cattle, goats, sheep and pigs. The score is achieved by processing sub-model outputs that characterize logistical factors: 1. Supply - Feed and livestock distribution. 2. Infrastructure - Transportation network (accessibility) 3. Atlas AI Asset Wealth Index. It consists of an arithmetic weighted sum of normalized grids (0 to 100): (”Livestock Density” * 0.4) + ("Asset Wealth" * 0.3) + (“Major Cities Accessibility” * 0.2) + ("Crop Production" * 0.1)