 FAO Map Catalog
Health
Type of resources
Available actions
Topics
Keywords
Contact for the resource
Provided by
Years
Formats
Representation types
Update frequencies
status
Scale
Resolution
-
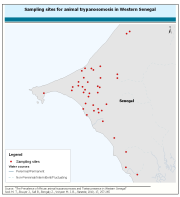
This dataset contains information on African animal trypanosomosis (AAT) in Western Senegal. Data were collected prior to the initiation of activities aimed at eliminating tsetse fly, the vector of the disease. Details on this dataset are availale in âThe Prevalence of African animal trypanosomoses and Tsetse presence in Western Senegalâ Seck M. T., Bouyer J., Sall B., Bengaly Z., Vreysen M. J. B., Parasite, 2010, 17, 257-265
-
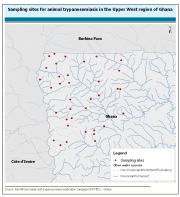
This dataset contains information on animal trypanosomiasis in the Upper West region of Ghana. It was generated within the framework of a tsetse and trypanosomiasis elimination campaign (Pan-African tsetse and trypanosomiasis eradication campaign (PATTEC) - Ghana).
-

This map represents outbreaks of HPAI reported from 1st Jabuary to 7th of June 2006. The original data have been collected and aggregated at the most detailed administrative level and for the units available for each contry. NOTE: FAO compiles information from numerous sources (FAO, OIE, Official governamental sources, EC, Reference Laboratories and others) and cannot garantee the veracity of all the information given. The map will be updated as soon as additional information becomes available.
-
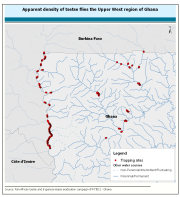
This dataset contains information on the apparent density of tsetse flies in the Upper West region of Ghana. It was generated within the framework of a tsetse and trypanosomosis elimination campaign (Pan-African tsetse and trypanosomosis eradication campaign (PATTEC) - Ghana).
-
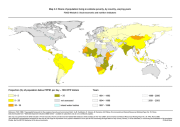
The FGGD extreme poverty map is a global vector datalayer at scale 1:5 000 000. The map depicts the differences among countries with respect to the national population estimated to be living in extreme poverty as of the latest year for which data was available in 2005. Data have been compiled by FAO from data reported in World Bank, WDI Online, as of April 2005.
-

The dataset contains the predicted areas of suitability for four tsetse fly species (f. fuscipes, morsitans, pallidipes and tachinoides). All of the distributions have been produced using variations of the same methodology - by modelling the "known" presence and absence of the flies (usually the 1977 Ford and Katondo maps modified with more recent information collected from national and international agencies and researchers). The modelling process relies on logistic regression of fly presence against a wide range of predictor variables for a large number of regularly spaced sample points for each area. The predictor variables include remotely sensed (satellite image) surrogates of climate - vegetation, temperature, moisture - which have been subjected to Fourier processing to provide an additional set of season and timing related measures for each parameter. Demographic, topographic and agroecological predictors are also used. These models are then applied to the predictor imagery to determine the predicted areas of suitability for tsetse. Data are provided at 1 kilometre resolution over the tsetse affected area in Ethiopia. The maps were produced in May 2002 for FAO/IAEA Joint Division by Environmental Research Group Oxford (ERGO Ltd) in collaboration with the Trypanosomosis and Land Use in Africa (TALA) research group.
-
The dataset contains the predicted areas of suitability for three tsetse fly species (f. fuscipes, morsitans and pallidipes). All of the distributions have been produced using variations of the same methodology - by modelling the "known" presence and absence of the flies (usually the 1977 Ford and Katondo maps modified with more recent information collected from national and international agencies and researchers). The modelling process relies on logistic regression of fly presence against a wide range of predictor variables for a large number of regularly spaced sample points for each area. The predictor variables include remotely sensed (satellite image) surrogates of climate - vegetation, temperature, moisture - which have been subjected to Fourier processing to provide an additional set of season and timing related measures for each parameter. Demographic, topographic and agroecological predictors are also used. These models are then applied to the predictor imagery to determine the predicted areas of suitability for tsetse. Data are provided at 1 kilometre resolution. The maps were produced in December 2001 for FAO/IAEA Joint Division by Environmental Research Group Oxford (ERGO Ltd) in collaboration with the Trypanosomosis and Land Use in Africa (TALA) research group.
-
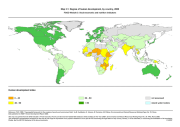
The FGGD degree of human development map is a global vector datalayer at scale 1:5 000 000. The map depicts national statistical data and highlights differences among countries with respect to the human development index for the year 2000. Data are from UNDP, 2002, Human Development Report.
-
The dataset contains the predicted areas of suitability for the three tsetse fly groups (Fusca, Palpalis and Morsitans) and for 24 tsetse species. All of the distributions have been produced using variations of the same methodology - by modelling the "known" presence and absence of the flies (usually the 1977 Ford and Katondo maps modified with more recent information collected from national and international agencies and researchers). The modelling process relies on logistic regression of fly presence against a wide range of predictor variables for a large number of regularly spaced sample points for each area. The predictor variables include remotely sensed (satellite image) surrogates of climate - vegetation, temperature, moisture - which have been subjected to Fourier processing to provide an additional set of season and timing related measures for each parameter. Demographic, topographic and agroecological predictors are also used. These models are then applied to the predictor imagery to determine the probability of fly distributions. Data are provided at 5 kilometres resolution for the whole sub-Saharan Africa. The 5km continental maps were produced in November 1999 for FAO Animal Health and Production Division and DFID Animal Health Programme by Environmental Research Group Oxford (ERGO Ltd) in collaboration with the Trypanosomosis and Land Use in Africa (TALA) research group at the Department of Zoology, University of Oxford.
-
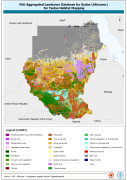
This dataset is an aggregated version of the original national Africover landcover multipurpose database. A 26-class legend is used to aggregate the classes present in the original full resolution, multipurpose landcover database. A single legend is applicable to the eight trypanosomiasis-affected countries mapped during Africover project (Burundi, Democratic Republic of the Congo, Kenya, Rwanda, Somalia, Sudan, Uganda and United Republic of Tanzania).