 FAO Map Catalog
GeoTiff
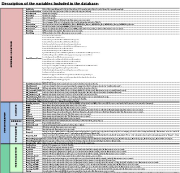
Type of resources
Available actions
Topics
Keywords
Contact for the resource
Provided by
Years
Formats
Representation types
Update frequencies
status
Resolution
-
Irrigated Areas of the Ghataprabha (K3) sub-basin.The data is obtained from the Global Map of Irrigated Areas (GMIA version 5) which provides information on surface and groundwater equipped irrigation. More information on the "Update of the Digital Global Map of Irrigation Areas to Version 5" report at http://www.fao.org/3/I9261EN/i9261en.pdf.
-

Historic Agricultural Drought Frequency Maps depict the frequency of severe drought in areas where 30 percent/50 percent of the cropland/grassland has been affected. The historical frequency of severe droughts (as defined by ASI) is based on the entire ASI Annual Summary times series (1984-2021). Formula: The number of years when land affected>30 percent/50 percent occurred/(2021-1984+1) *100 Pixel value ranges from 0-100 (unit: percentage). Flag: 252: no data; 253: no season; 254: no cropland/grassland. More information, please visit FAO GIEWS Earth Observation website: https://www.fao.org/giews/earthobservation/index.jsp?lang=en Data license policy: Creative Commons Attribution- NonCommercial-ShareAlike 3.0 IGO (CC BY-NC- SA 3.0 IGO) Recommended citation: © FAO - Agricultural Stress Index System (ASIS), http://www.fao.org/giews/earthobservation/, [Date accessed]
-
Saturated soil water content calculated over the Jordan River Basin area in Jordan. The dataset is derived from the High Resolution Soil Map of Hydraulic Properties (HiHydroSoils v1.0).
-
Grid cell-specific runoff, including surface runoff, lateral runoff, and percolation water. Inflow from neighboring cells is not included. Unit: mm Climate Input: MIROC5, CanESM, GFDL Downscaling method/bias correction: RCA3, QMBC, SOMD CO2 scenarios: B1 transient CO2, B2 constant CO2 at 1960 level (316.27ppm) Land use: land use is kept constant at the year 2000 distribution. Temporal Extent: 1961-2099 (monthly resolution) Spatial Extent: Africa Spatial Resolution: 0.5° grid cell This data set has been produced in the framework of the "Climate change predictions in Sub-Saharan Africa: impacts and adaptations (ClimAfrica)" project, Work Package 3 (WP3). WP3 aims at quantifying the sensitivity of vegetation productivity and water resources to seasonal, inter-annual and decadal variability in weather and climate, using impact models on agriculture and water. The available models in combination with developed datasets of land use and climate from WP2 were used to simulate crop yield and water resources. Simulations using short-term scenarios of future climate change (5-10 years) were used to identify regional differences in the climate sensitivity of crop production etc. Scenarios for the African agricultural/pastoral sectors were also made using longer model runs. Finally, tradeoffs and areas of risk and vulnerability were identified in relation to: - Water-related hazards; - Agricultural and pastoral performance; - Soil degradation. More information on ClimAfrica project is provided in the Supplemental Information section of this metadata.
-
Climate Hazards Group InfraRed Precipitation with Station data (CHIRPS) is a 30+ year quasi-global rainfall dataset. CHIRPS incorporates 0.05° resolution satellite imagery with in-situ station data to create gridded rainfall time series for trend analysis and seasonal drought monitoring. Approximately 5km (0.05°) unit: "mm" dataType: "Float32" noDataValue: -9999
-
Irrigated Areas of the Malaprabha (K4) sub-basin.The data is obtained from the Global Map of Irrigated Areas (GMIA version 5) which provides information on surface and groundwater equipped irrigation. More information on the "Update of the Digital Global Map of Irrigation Areas to Version 5" report at http://www.fao.org/3/I9261EN/i9261en.pdf.
-
Saturated soil water content calculated over the Nile River Basin area. The dataset is derived from the High Resolution Soil Map of Hydraulic Properties (HiHydroSoils v1.0).
-
The dataset includes a set of socio-economic field collected data in a wide range of Sub-Saharan African communities. The main parameters include: · Historical climate events (description of main climatic events described by the surveyed communities); · Mental models (conceptual understanding of climate change as perceived by local communities); · Participatory risk mapping (main risks/hazards to livelihood perceived by local communities); · Stakeholders analysis (identification of institutional structures that come into force under environmental stress); · Household demographics; · General household livelihood portfolio; · Household vulnerability mapping (identification of main stressors at household level); This set of data has been produced in the framework of the "Climate change predictions in Sub-Saharan Africa: impacts and adaptations (ClimAfrica)" project, Work Package 6 (WP6). For more information on the following work packages produced, please contact the data originator indicated in the Point of contacts section of this metadata. • Project Deliverable D6.1 - Catalogue of selected watersheds for the case studies. • Project Deliverable D6.2 - Reports on site characteristics of the model areas using a standardized format. • Project Deliverable D6.3 - Database of relevant eddy covariance measurements from the available CarboAfrica (FP6 project) flux sites to be delivered to WP1 and WP2 for model development. • Project Deliverable D6.4 - High spatial and temporal resolution time series combining high and medium spatial resolution satellite data for assimilation and phenological modelling.
-

GSOCmap is the first global soil organic carbon map ever produced through a consultative and participatory process involving member countries, which makes this map totally new and unique. In fact, the map was prepared by member countries, under the guidance of the Intergovernmental Technical Panel on Soils and the Global Soil Partnership Secretariat. Countries agreed on the methodology to produce the map and were trained on modern tools and methodologies to develop national maps. The Global Soil Partnership then gathered all national maps to produce the final product, ensuring a thorough harmonization process. Note: The dataset comes along with a technical report which presents methodologies and the process of compiling the Global Soil organic Carbon Map. The link to download the report is available in the on-line resources.