 FAO Map Catalog
climate
Type of resources
Available actions
Topics
Keywords
Contact for the resource
Provided by
Years
Formats
Representation types
Update frequencies
status
Scale
Resolution
-
The FGGD CV of LGP map is a global raster datalayer with a resolution of 5 arc-minutes. Each pixel contains an average coefficient of variation of LGP for the pixel area over the period 1901-1996. The data are from FAO and IIASA, 2000, Global agro-ecological zones, as reported in FAO and IIASA, 2007, Mapping biophysical factors that influence agricultural production and rural vulnerability, by H. von Velthuizen et al.
-
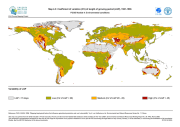
The FGGD climate constraints map is a global raster datalayer with a resolution of 5 arc-minutes. Each pixel contains a class value for the degree to which climate constrains agricultural production potential in the pixel area. The data are from FAO and IIASA, 2000, Global agro-ecological zones, as reported in FAO and IIASA, 2007, Mapping biophysical factors that influence agricultural production and rural vulnerability, by H. von Velthuizen et al.
-

Dryland map derived from the Aridity index map (P/PET).
-
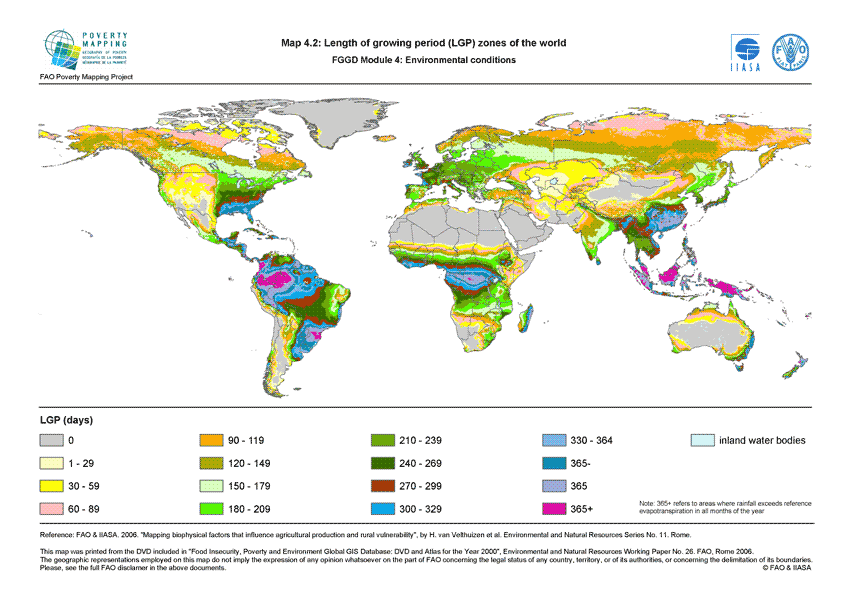
The FGGD LGP zone map is a global raster datalayer with a resolution of 5 arc-minutes. Each pixel contains a class value for the dominant LGP zone found in the pixel. The data are from FAO and IIASA, 2000, Global agro-ecological zones, as reported in FAO and IIASA, 2007, Mapping biophysical factors that influence agricultural production and rural vulnerability, by H. von Velthuizen et al.
-
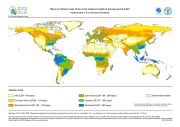
The FGGD CV of LGP map is a global raster datalayer with a resolution of 5 arc-minutes. Each pixel contains an average coefficient of variation of LGP for the pixel area over the period 1901-1966. The data are from FAO and IIASA, 2000, Global agro-ecological zones, as reported in FAO and IIASA, 2007, Mapping biophysical factors that influence agricultural production and rural vulnerability, by H. von Velthuizen et al.
-
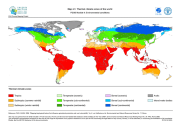
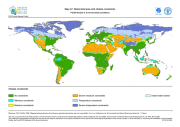
The FGGD thermal climate zone map is a global raster datalayer with a resolution of 5 arc-minutes. Each pixel contains a class value for the dominant thermal climate found in the pixel. The underlying temperature data are from the Climate Research Unit (CRU) at the University of East Anglia-Norwich, as reported in FAO and IIASA, 2007, Mapping biophysical factors that influence agricultural production and rural vulnerability, by H. von Velthuizen et al.
-
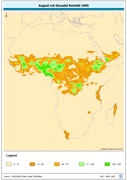
April 1st-Decadal Rainfall 1996. The APR1_95 grid data layer is comprised of 1152x1152 derivative raster precipitation features derived based on 8 kilometers data originally from EDC. 2nd and 3rd Decadal Rainfall from January to December is also available for download. Acronyms and Abbreviations: EDC - USGS EROS (Earth Resources Observation Systems) Data Center
-
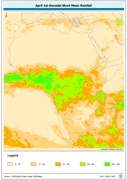
April 1st-Decadal Short Mean Rainfall. The APR1_SM grid data layer is comprised of 1152x1152 derivative raster precipitation features derived based on 8 kilometers data originally from EDC. 2nd and 3rd Decadal Rainfall from January to December is also available for download. Acronyms and Abbreviations: EDC - USGS EROS (Earth Resources Observation Systems) Data Center
-
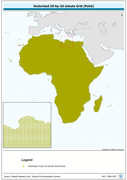
Vectorized 10-by-10 minute Grid (Point). The CRU_PT shapefile data layer is comprised of 92718 derivative calculated climate features derived based on 0.167 degrees resolution data originally from CRU. The layer provides nominal analytical/mapping at 1:70 000 000. Acronyms and Abbreviations: CRU - Climatic Research Unit - School of Environmental Sciences, University of East Anglia - Norwich.
-
The Food and Agriculture Organization of the United Nations (FAO) with the collaboration of the International Institute for Applied Systems Analysis (IIASA), has developed a system that enables rational land-use planning on the basis of an inventory of land resources and evaluation of biophysical limitations and potentials. This is referred to as the Agro-ecological Zones (AEZ) methodology.